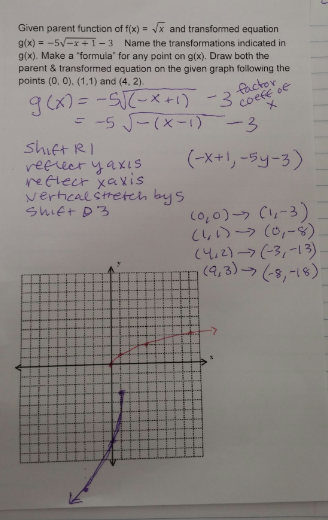
This post has to do with how we handle transformations. I assume students remember everything from Algebra 2 and we can move right into more complicated stuff (ha!).
We start by looking at the transformation problem students had on their summer packet.
...of course they were not so strong on this when they completed the summer packet, so we worked through it together in class.
When a function has multiple transformations it can be very tricky to graph. The one above has four transformations. Keeping those 4 transformations in your head and applying them step by step to a point can be difficult. I've seen some teachers have students create a table with the columns representing the transformations and the rows representing the points. The cells in the table show what each points changes to with each transformation. Some of my students would love this but it's really way too time consuming. Instead we create a "formula" to represent the transformations as applied to the parent point (x, y). Then any ordered pair from the parent function can be put into the formula and the new final version of the ordered pair will result.
For example the summer problem example above has the following transformations:
Each transformation affects either the x or y coordinate. We create a formula for those transformations:
Then it's easy enough to identify the new location of the original parent points and create our transformed graph.
After this discussion we create our foldable. Students help identify what each is and what we should write about each.


Then we apply these to an example. This one is a bit tricky because the "horizontal shift" is obscured by the coefficient of x. I stress the important of factoring the coefficient of x (yet keeping it inside the function operation to see the true behavior). I like having both the parent function (usually in red) and the transformed function on the same graph so students can see how they are different relative to each other.

I have a few worksheets that I created for students to do practice work on these skills. They must be able to do this all without a graphing calculator. On homework they can check their graphs on their graphing calculator (graph, then use [TRACE] to check the new transformed points). But they can't use calculators on assessments.
You can find all my files for transformations here (foldables, worksheets).


