Wednesday, September 30, 2015

PreCalculus Symmetry (odd, even or neither)

Our final function characteristic is symmetry. This is largely visual at first.


We start off by identifying letters of the alphabet that have vertical line symmetry, horizontal line symmetry and multiple line symmetry. I write those headings on my whiteboard and have students go up and draw examples with the dotted lines of symmetry. (oops forgot to take a picture of this!).


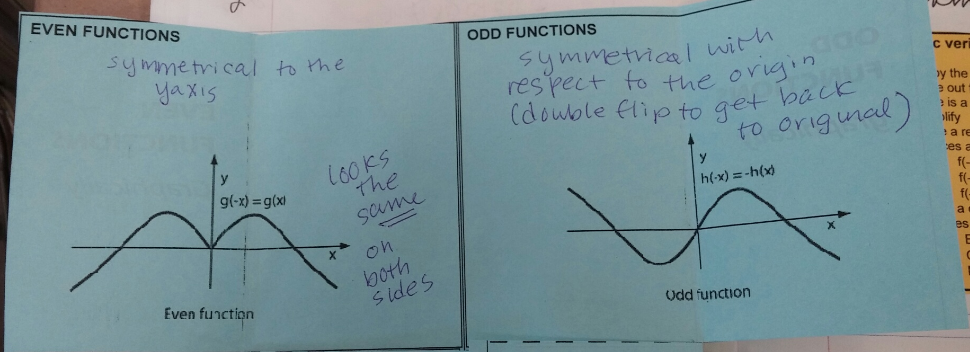
Then we talk about how we can do the same with functions but can't just do any horizontal or vertical line when discussing symmetry. We need a standard horizontal line to be symmetrical to & a standard vertical line to be symmetry. Aha - how about those axes? So then students draw some visuals for both of those - soon realizing that symmetry with the x-axis results in something that is not a function. For multiple line symmetry - we talk about symmetry with respect to the origin (or a double flip to get back to the original - a flip over each axes - helps them visualize it). So we figure out what parent functions appear to be symmetrical and what type they have.

We use a foldable to organize our information in this lesson.


Next is getting the vocab down - we have EVEN and ODD functions. Interesting names, no? Wonder what relevance they have.....


Then nasty little teacher as I am I point out - oh no, remember that we can't take what we "see" at face-value. A visual is not enough to prove anything mathematically. I tell students that we have to verify in a general way algebraically, following a set format. Sort of mini-proof like. Some students get pretty annoyed at this, why do we have to do that? Hey, all I can say is "justify, justify, justify". If I'm not convinced then it's not true.


Of course there is always the student who doesn't believe me when I tell them they must have each part. Sigh. They do. And if they don't it will be reflected in their grade. Sigh. 

My students learn that I am a big fan of shortcuts but I also insist on precision. 

All precalculus foldables are found here


Monday, September 28, 2015

PreCalculus End Behavior

Well we are getting close to the "end" of our function characteristics (haha) as we look at end behavior.

Previously we did a short bit on what a limit is. The rationale being that students use limit notation to describe end behavior but don't really know what limit notation is.

Students learned about end behavior in Algebra 2. But didn't use limit notation. They used a little short cut way of writing it. For example a standard cubic graph would be:

LEB & REB:
http://hotmath.com/hotmath_help/topics/end-behavior-of-a-function.html

We transition to writing this with limit notation. And the idea is since we went over what a limit was and students had to find limits they would be a little better at writing this in limit notation. We'll see!

We start with a few functions on the white board (I ask students to go up and draw a standard parabola, then one opening down, then a standard cubic, then one that is reflected over the y-axis, then a basic rational function with VA x = 2 and HW y = 1 and then an exponential function that is shifted down 3). We talk about the end behavior of each graph. Using what they know about limit notation can they come up with a way to describe the end behavior in limit notation? After working in their groups I have them share what they come up with. Since this is an advanced class they pretty much go where I intend them to.

And so we summarize with a foldable:


And then on the "right side reflect" they apply their new end behavior writing skills to do the following examples:


PreCalculus ISN foldable stuff here.


Sunday, September 27, 2015

A Short post on Logistic Functions

Just a little foldable....

Students have already seen logistics in Algebra One (most of them) and Algebra 2. But just brushed upon them. And they really are cool. Because if you think about it they really are much more realistic than exponential growth. I mean what real life situation really follows a true exponential growth pattern. Somewhere its got to level out due to natural restrictions in the environment.

We use this ppt slide to discuss just that fact in my Algebra One classes.

So in PreCalculus, we don't directly teach these again. But I want the students to have a full inventory of the parent functions in their ISNs. Previously we did parent function entries in this whole beginning section of "parent functions". And I had them leave an empty half page on the logistic page. We were saving it for this foldable. 


It is designed to give some context to a crazy looking function equation. They will see logistics again and they are cool realistic functions to be aware of. And many students like to throw in a little piecewise logistic function curve in their graphing calculator picture project. So this little review gives them enough information to have  a little useful knowledge about this function type.

Here is the inside of the foldable. 


Students worked in their groups on this. It was interesting to hear the conversations they were having about adjusting the window. One student had both their xmax & ymax = 1,500,000. Good thinking for the ymax but I don't think Dallas will exist 1.5 million years after 1900 but perhaps that is pessimistic of me.

So that's it, short & sweet.

All my foldable files for precalculus unit 1 (function characteristics) are found here.

And here is where you will find my Algebra One logistic materials if you need some extra stuff.


Friday, September 25, 2015

Checking Solutions on Graphing Calculator Alg One (revised!)

I've done this with my classes over the years. This year I updated my ISN to show this in a more "step by step" manner. It takes a while to go through all these pages and to be sure students are getting it. And it takes patience. It took me 2 classes blocks to do these. After every step I had to check in with each student to be sure they were with me. They would not tell me otherwise unless I checked each person - that's when I found students who were having trouble. Then you have to be super patient and upbeat so they don't get turned off to working with the calculators. For the "technology-generation" I find students can sometimes really struggle with the graphing calculators. Maybe if I tell them it's a phone?

So we ultimately do this 2-page spread. But we do it step by step with students doing the same thing on their calculator.

We've already done a lot of solving and students are quite good at that. And they know how to check a solution by substituting it for a value of x and simplifying.

So we start with the "table method".

As we go through this we highlight the keys we are using corresponding to the highlighted words for the keys in our instructions.

Remember - step-by-step and check everyone as you go.  Patience....

Then we go through the example together. Step by step. I have them write what they see on the table. They won't do this every time they use this method to check. We are just doing it now to confirm what we see. 

Next we check with the graph. Basically checking the point of intersection.

This page involves cutting out fussy little bits for them to glue next to the steps. Thank God for a paper cutter.

The "intersect process" has multi-steps of [enter][enter][enter] so we have an accordion fold set of graphs to show that progression.


Finally I give them the intersection graph to glue in their notebook. I don't hand that out at the start. I want them to get it on their calculator screen first.


Now we revisit those "always true" and "never true" equations we saw earlier. The ones that end up with an "identity" or an "anti-identity" (the later being my made-up word).

They've seen these and have solved and had these as solutions. But this page "formalizes" it a bit and gives them the symbols they can use to show the solution.

We go over how to check that on the graphing calculator. Next year I'll change my examples. The parallel lines are very close together. We had to zoom out to see that they were indeed parallel and not the same line.


A few students in my class do not have graphing calculators at home. But they do have access to computers. So I tell them to go to desmos.com and use their graphing and table functions to check. I wrote up a short basic instruction sheet on how to do that.


Tuesday, September 22, 2015

PreCalculus - a basic look at limits

Another one of the properties of functions that we cover is describing end behavior. And we have students write this in limit notation. Without really going over what a limit is technically. Just teaching the notation.

This year I decided to do a little mini-lesson on limits to prepare for deeper understanding of the limit notation for students.

We've already done "limits" informally without using that language when we looked at asymptotes and especially when we examined "holes" in rational functions more closely. I always have the students figure out the point of discontinuity for those "holes" by choosing values close to the offending x value. We do this on our graphing calculators on the graph using the "trace" option of finding function values with x-values that we type in. If the hole is at x = 1 students will only see [x = 1 y =   ] on the screen. So we try values "around" one. We try x = 0.9999 and x = 0.0001. All very limit like without saying so.

I set the stage by reminding them of what asymptotes are and what we did when we found those holes. Also we reviewed what students learned about end behavior in Algebra 2. They did learn this concept but had another way to describe it with LEB and REB. Not limit notation, but has some similarities.

Then we go into defining and exploring with a limit is. I use this "french-door" foldable to do this.

We do "What is a limit" and then "what is limit notation". Then we do the geometric visual (love this) and then the classic limit example.


Then we do the two examples. The first one does have a value at the given value of x, so I tell them we can use "substitution" to find that limit.

The second one can not be evaluated at the given value of x, so we examine the value using the table function of our graphing calculator.


We first change our table set up so the independent variable is Ask. [2nd][window]

Then we type the equation in Y1 [y=]

Then we go to the table [2nd][graph]. Clear any values you might see with [del] (delete).

Now with a fresh empty table we can type values in close to our given x. I tell them to go ahead and type in x = 1, they get a rude little ERROR in the table.

The students see from the table that values get closer and closer to 2 as the values of x get closer and closer to 1. So that's our limit. Yay!

Then they get a little homework of finding other limits the same way - either substitution or with the table. Next class - End Behavior.

Foldable documents here.


Monday, September 21, 2015

PreCalc Function Characteristics part 2

So we continue examining various characteristics of functions. Part 2 is looking at piecewise functions (and specifically how to do them on our graphing calculator) and then continuity in functions. The later is really just visual at this point - it's something they'll explore more in calculus.

Piecewise functions

Students have already explored these in Algebra 1 & 2. They should remember what they are, how to graph them and how to evaluate values in a piecewise function. I know in my Algebra 1 class we do some real life examples too so students see where piecewise might make sense. 

Here we do a tiny little review but then really look at piecewise in the context of continuity (and determining the domain & range).

We do a notes page in our interactive student notebooks (ISNs). Then students try to create a piecewise picture on their graphing calculator given instructions. 
After that we create an ISN page showing our results. 
Students were pretty excited about this.


And I use this opportunity to plug my "graphing calculator project" that they get in December. In this project they draw a picture on their calculator with pieces of functions. At least 30 pieces, usually more like 50 or so. It's a great project. Will blog about it later. Students love it. And it's really time consuming. But great. 

Okay, now we've reviewed piecewise functions and have covered rational functions. We can now ease into what "continuity" means. We really do this more visually than anything else. But we do categorize the types of discontinuity.

We start with a foldable of course, in our ISN.
We fill the inside in. I use my document camera to project and fill things in with the students.

Behind the left two doors:
and the right two doors:

And then on their "right side reflect" page opposite this foldable students work through 4 examples. Here is the work for those examples:


From here they have some homework and two classes from now I'll be giving an assessment to see how they are at analyzing functions with the tools we have so far (domain, range, boundedness, asymptotes, continuity).

And part 3 will be looking at the basics of limits & describing end behavior with limit notation. After that part 4 is symmetry in functions (even vs odd).

Foldable documents can be found here


Sunday, September 20, 2015

The Box Problem Updated

Phew - finished correcting those Box Problems (see post from Sept 9th 2015). They were great. Really. But so time consuming to grade. And I'm efficient - been doing this for 25+ years. I have a system where I sketch out what each section should have and points for each part. Then I do the first item in the rubric for every student. Then the second item for every student. Then the third. And so on. This way I am consistent in what I am scoring and what comments I am making. Also I kept track of good responses to each part so I could share what a good response looks like. This all took about 6 hours. For about 45 projects in all. There goes my Saturday. (I did get in a hike and a little grocery shopping).

Of course when I correct any project/performance task I make notes of things to tweak for next year (or typos to repair). So what I posted on the 9th has been updated here.

One thing I added was a "Perseverance Score" on the rubric. Our math department is trying to integrate all the math practice standards into our work but one in particular is MP1:

CCSS.Math.Practice.MP1 Make sense of problems and persevere in solving them.

Mathematically proficient students start by explaining to themselves the meaning of a problem and looking for entry points to its solution. They analyze givens, constraints, relationships, and goals. They make conjectures about the form and meaning of the solution and plan a solution pathway rather than simply jumping into a solution attempt. They consider analogous problems, and try special cases and simpler forms of the original problem in order to gain insight into its solution. They monitor and evaluate their progress and change course if necessary. Older students might, depending on the context of the problem, transform algebraic expressions or change the viewing window on their graphing calculator to get the information they need. Mathematically proficient students can explain correspondences between equations, verbal descriptions, tables, and graphs or draw diagrams of important features and relationships, graph data, and search for regularity or trends. Younger students might rely on using concrete objects or pictures to help conceptualize and solve a problem. Mathematically proficient students check their answers to problems using a different method, and they continually ask themselves, "Does this make sense?" They can understand the approaches of others to solving complex problems and identify correspondences between different approaches.
In particular my rubric states the following:
1)     Perseverence  - (math practice standard 1) Demonstrates ability to make sense of problems and persevere in solving them.
This standard states that students should be able to do the following:  Mathematically proficient students start by explaining to themselves the meaning of a problem and looking for entry points to its solution. They analyze givens, constraints, relationships, and goals. They make conjectures about the form and meaning of the solution and plan a solution pathway rather than simply jumping into a solution attempt. They are able to transform algebraic expressions or change the viewing window on their graphing calculator to get the information they need. Mathematically proficient students check their answers to problems using a different method, and they continually ask themselves, "Does this make sense?"
                     In this first project students will be allowed one clarifying question but more                  questions and more direct levels of help will result in deductions on this section.

These honors students don't like this very much. They want you to tell them that they are doing something correctly. Overall though I only had a few students come see me before this was due. Everyone was in good shape and seemed pretty well prepared for this project. The scores were good. Not too many As. Lots of Bs. Because there is a tweaky little thing in the graph that the students think is in the problem situation domain but really isn't.

And students just aren't comfortable with "being suspicious" of weird behavior on a graph. They just assume since it is in quadratic I it must be part of the problem situation domain. But a few were curious and investigated and really understood that weird little bit.  I LOVE it.

My mantra this year with my precalculus student is to BE CURIOUS. Investigate weird stuff. And we've been looking at functions that do weird things (especially rational functions and piecewise right now). So that little section in this project emphasizes that.

When I hand these projects back, I'm going to go over each part (briefly!) and show them a "good" response. There were lots of good responses for each part. But I chose one and photocopied it (deleting anything that showed the identity of the student who did that response) and will show it to the class with my document camera. I'll do this for each part but then also post a pdf document of all the parts together on my web page that students can look it over. And consider their responses with respect to what I deem as good responses. (I don't want to post it here, just in case sometime in the future a students stumbles upon it and uses it to do their project. You never know. If a teacher is interested in this composite document, just send me your school email address and I'll send it off to you).

Hopefully this will help the students with their next project - Minimizing the cost of a soda can.
http://www.debbiewaggoner.com/math-practice-standards.html

Wednesday, September 16, 2015

Verifying Number Puzzles Algebra One

Okay, so my students know how to use the distributive property and combining like terms to simplify algebraic expressions. They had excellent coverage of this in 8th grade math last year, so they are ready to go with equation solving with just one day of review (including properties of multiplication & addition).

But students need to be able to justify steps in equation solving.

So this year, I decided to add another lesson in to get that "verification skill" going.

Number puzzles. Those kinds that start with "think of a number" and you do a bunch of things and the person directing the puzzle then can predict what you end up with. How do those really work? How do we figure it out? Using Algebra of course.

So I do a few with the students - where they choose a number. And I tell them we are going to verify.

We build an expression using x. 
Then we simplify that expression, verifying each step of the simplifying process with properties or processes.

This one is a little harder. You have to use two different variables.


We also fill in ISN pages 

inside there are two other problems that we verify....(see my original documents below for the problems, the left side of this scan was cut out)

Then students make up a problem.....here are my instructions (sort of following the format of the second problem inside the foldable).


Then we finish off with a silly puzzle - Chocolate Math - on this powerpoint. I didn't try verifying it with students, It would be challenging. Something to offer a challenge on to students though.


And I give them a little exit slip - it's not a puzzle problem. Just a simplify problem that they have to examine to see what a student did wrong. And explain using all the correct vocabulary etc.

All documents found here


Friday, September 11, 2015

PreCalc Function Characteristics part 1

If you've been following my PreCalculus posts you saw that my students started the year by reviewing some function characteristics that they learned in Algebra 2. Now we get into all the other characteristics we use to analyze functions. Basically most of this course is functional analysis.

I have students create notebook pages about the characteristics with foldables and examples they work out.

We started by looking at all the function characteristics they would be learning using this checklist:
We've already done #s 1 - 7. So we move on to Boundedness. We used this foldable to define & explore


 Then asymptotes. Asymptotes can be so interesting. We dabble in them a bit but I'm sure weeks can be spent on this. First we used this foldable to summarize the two main types with a little summary bit on rational functions:

inside:


We did a little pause here and went back to our parent function pages (see this blog post) and filled in who was bounded and what type and who had asymptotes and what type.

 Then we did some examples on the page opposite. The first two examples gave me an opportunity to review transformations a bit when figuring out where those asymptotes were.


Together with the foldable the two-page spread looks like this:


 Then because rational functions are so interesting I decided to do a two-page spread called "crazy rational functions" just so we could see the asymptote options. (unit 2 we do even more with rational functions but I felt like we had to address them a little bit more here).

I used this foldable
We didn't get to finish filling in the whole insde but this is what we did so far (and the examples we'll continue with in our next class):


 I'll then have students do three examples themselves (conferring in their small groups) after we complete the above foldable. The two page spread looks like this:


And a final side note - I really like the information on the coolmath.com site. She handles rational functions in a "fun" way. I get my students using the "king of the top divided by the king of the bottom" to help them figure out the type of asymptotes they should get. See her pages on rational functions here. 

All my function characteristics foldables can be found in this file here.