Showing posts with label algebra one. Show all posts

Wednesday, February 3, 2016

Mixture Problems in Algebra One

This intiative by #MTBoS has been great - I've been better about blogging and visually documenting what I do in class.  And it's been great fun to read other blog posts on the weekly initiatives. This latest directive is to blog about a lesson. This is mostly what my blog is about - blogging on lessons I do and the interactive student notebook materials I use/create. 

Teaching mixture problems using systems of equations can be challenging because it can be difficulty to visualize what they are about. I'm all about visualizing and understanding concepts (for myself and for my students). This lesson sets the stage for building understanding about the concepts underlying mixture problems.

The class is Algebra One, honors level, ninth grade. We've been working with systems of equations for about a week and a half now. Students learned about systems last year in 8th grade, mostly focusing on solving systems using graphs. I started this unit by focusing on creating models for situations with two conditions and two unknowns (see this blog post). We then learned how to solve the algebraic models without graphing and I incorporated applications problems as I went. Mixture problems are their own little category of applications though, so I introduce those separately.

This year I decided to introduce mixtures visually with something all students love - cereal! Last year my student teacher and I talked about this idea and she implemented it in her classes (thank you Tess!) so I took her good work and tweaked it a bit for my class this year. 

I set up a little "Research & Development Lab" in the back of my classroom:

Those ziploc bags each hold an ounce of the labeled cereal (about a heaping cup of each).

And provided some facts that our research team is using:

The question was how many ounces of each type (Kix & Cocoa Puffs) would have to be in this blend to achieve the size and cost we are aiming for? Students saw that this was a situation with two unknowns and two conditions. So it was time to organize this information into a system of equations (all this comes from student responses):


The tricky bit of course is in setting up the equation that represents the cost. Students have to remember that the sum represents the cost of each individual type of cereal (cost per ounce times number of ounces) so that must be equal to the cost of the new cocoa kix cereal box (cost per ounce times the total number of ounces in our prototype box).

Once we got this all set up students solve the system. Now the fun part - we actually measured out a "box" of this special blend together.  And then students got to sample the cereal (yum). I gave everyone a small cup full of the cereal to munch on.


So how did this work? Well it was certainly fun and I have a bright bunch of kids this year so they were able to create the system pretty easily. I handed out the cereal samples for students to munch on while we did some problems together  but there were only 10 minutes left to class and I think everyone was too excited snacking to really think about any more problems. I started to work on an ISN foldable looking at different types of mixture problems but gave that up pretty quickly. Instead I gave them two problems to try for homework and figured the next day we would pull things together.

DAY #2 on Mixtures

Before I went over homework and got any feedback from students I had them work in small groups at the board on mixture problems similar in nature to what we did in class with the cereal. After the group solved theirs they had to switch and analyze the solution and work of the problem next to theirs.


This worked really well and students said they were understanding mixture problems better.

Then we focused on mixture problems that contain percents (including interest problems).

After that we used our ISN to summarize our learning with the left page containing a foldable showing 4 examples that the students set up systems for...


(inside bits here:)


and the right page solving those systems.


All files used in this lesson (worksheets, board problems & ISN foldables) can be found HERE.


Sunday, January 31, 2016

Start a Lesson With a Question

Whenever possible I try to start any lesson with a question to lead into what we are learning that day. This is a real shift from when I started teaching in the 80s - teaching training then focused on "tell tell tell" while students listened. Being the kind of learner that needs to understand I was never a big fan of that and figured out how to make questioning a bigger focus of my teaching. Marilyn Burns was a great mentor for this and I used her book

Collection of Math Lessons, A: Grades 6-8  a great deal when I taught middle school.


Anyhow back to this blog post...Here I am focusing on the 3rd week of the MTSoB blogging initiative

So to repeat myself - Whenever possible I try to start any lesson with a question.

Algebra One last week we were starting systems of equations. I knew that students had dabbled in this in 8th grade - they had solved systems of equations using graphing and perhaps had been exposed to some algebraic methods. But did they really know what a system was? I love really knowing what certain math concepts ARE and what they are good for (not always real life applications, just how they interconnect with other things I know about math), It's really the only way I can learn math. 

So I started class with this question..
What are some mathematical models that we can use to solve problems?
Students came up with great responses (almost like there were cue cards or something) - Graphs, Tables, Equations.  Yay! But this wasn't really the question to lead the lesson, this was the warm up. Next I asked them
 You have a bunch of quarters and dimes. 
The value of your coins is $3.00. 
How many of each coin do you have?

My students sit in small groups so I let them work on that. They gathered up some graph paper and made beautiful linear graphs of this situation with a lovely equation to accompany it. We talked about whether this graph was continuous or discrete and whether we would consider values in all four quadrants. Also with some prodding they came up with a table showing the possible solutions. Great work!
Then I told them that this question presented them with a situation that had two unknowns (number of quarters & number of dimes) and one condition that established a relationship between the unknowns. It resulted in a number of possible solutions. What if I gave them another condition to partner with this information?
 What if the number of dimes is two more than the number of quarters?
Then students worked on narrowing things down with this condition. They added on to the models they already created (another line on the graph, another equation for that condition). They found that this second condition resulted in a unique solution. Cool.
These initial questions allowed us to explore situations with two unknowns and two conditions that would have a unique solution. From here we could define systems of equations (after we did a few more examples) and keep in mind that is what drives a system of equations in two variables. Two unknowns and Two conditions. 
I put all our questions on a powerpoint. I also have a homework sheet to accompany this. We created a cool foldable for our notebook of an example (this was used the next class block as our warm up).  All supporting materials can be found at this link.
Here's the foldable I used with my students to illustrate these models. It's a cool "4 square fold" that my student teacher found last year (thanks Tess!). So it allows you to get a lot of information down in once place.

Here is the front all folded up into 4s (see how it folds up to use only half the page?):


Open it once and you get two places to have information:


Completely open it up and there are 4 places to have information:


Monday, November 9, 2015

Domain & Range Tool

I blogged about this domain & range tool a bit in a post this summer  but today I used it in the classroom and it was really great and I wanted to share this again with updated pictures to show how it worked out.

Domain and range from a graph can be quite tricky. I do this with my advanced algebra one group. This domain & range finder tool is a great way to visualize the domain & range.

They did have some homework last night that involved identifying which graphs are functions and trying to determine the domain & range of each (we had already defined domain & range and even filled in the DIX ROY bit the last class). Most kids came in to class today saying they didn't understand the homework. After going over homework we created our domain & range finder tool.

This tool can be a little "fussy" and I warned the students that today is a bit "artsy-craftsy". I really avoid doing anything too complicated with my foldables - there is the danger of it becoming a folding-cutting class rather than an algebra class. So I prepare quite a bit ahead of time. And I time the cutting and folding tasks to be done while I check homework and help students out in their small groups so it doesn't take away as much instruction time.

I also prepped by photocopying and doing some preliminary cutting with my paper cutter - so worth the time investment.

First everyone gets a pre-cut domain & range finder tool (we only have to fold it):


And an envelope foldable (partially pre-cut) and two strips of domain & range cards (8 cards all together).


We folded the tool and the envelope and glued everything in our notebooks before proceeding.


I walked through three cards with them, showing how to use the tool and how it helps us find the domain & range. So cool. So visual.


They had to finish the other five cards.

Then do the purple graphs on their notebook pages.

Then go back and do the back of the homework (some really challenging ones on that!).

As students worked I displayed answers via my document camera. More practice on a HW worksheet. Quiz next class!

All my documents can be found HERE. 

The original idea comes from math=love http://mathequalslove.blogspot.com/2013/08/algebra-2-interactive-notebook-pages.html - thank you again!  So many wonderful ideas in her blog. And she inspired me to do this blog to share my materials.

Wednesday, September 16, 2015

Verifying Number Puzzles Algebra One

Okay, so my students know how to use the distributive property and combining like terms to simplify algebraic expressions. They had excellent coverage of this in 8th grade math last year, so they are ready to go with equation solving with just one day of review (including properties of multiplication & addition).

But students need to be able to justify steps in equation solving.

So this year, I decided to add another lesson in to get that "verification skill" going.

Number puzzles. Those kinds that start with "think of a number" and you do a bunch of things and the person directing the puzzle then can predict what you end up with. How do those really work? How do we figure it out? Using Algebra of course.

So I do a few with the students - where they choose a number. And I tell them we are going to verify.

We build an expression using x. 
Then we simplify that expression, verifying each step of the simplifying process with properties or processes.

This one is a little harder. You have to use two different variables.


We also fill in ISN pages 

inside there are two other problems that we verify....(see my original documents below for the problems, the left side of this scan was cut out)

Then students make up a problem.....here are my instructions (sort of following the format of the second problem inside the foldable).


Then we finish off with a silly puzzle - Chocolate Math - on this powerpoint. I didn't try verifying it with students, It would be challenging. Something to offer a challenge on to students though.


And I give them a little exit slip - it's not a puzzle problem. Just a simplify problem that they have to examine to see what a student did wrong. And explain using all the correct vocabulary etc.

All documents found here


Thursday, September 10, 2015

Algebra One Sequences - Honeycomb Performance task

We start the school year with a short little unit on sequences. Not the usual longer approach you see in Algebra 2 or PreCalculus with sequences & series. Just dabbling in arithmetic and geometric sequences. A little bit with Fibonacci and Pascal's triangle. And maybe some "other" types (like triangular numbers). It's a nice way to start the year, looking at patterns and making sense of them.

I've had a few posts on this unit already. Some specifics on my ISN foldables and some expanded thoughts on developing the rules for arithmetic and geometric sequences.

This post is to share a little more information on how we end the unit. We do the usual test with study guide prep. But every unit in Algebra 1 in our school has a performance task. This one is called the Honeycomb Performance Task.

The Basic Task:

You are an engineer for Plasticore Corporation who makes custom tables of varying sizes for banquet halls. You have been asked to design and manufacture round banquet tables with layered honeycomb cores. Each honeycomb in the core has a height of one foot.  The size of the honeycombs do not change, as the size of the table increases the number of honeycomb layers increases.  


a)  Your team at Plasticore has been asked to build a table that measures 15 feet in diameter. Each individual honeycomb cell costs $0.25 to manufacture, including material and labor costs. What is the total cost to manufacture the honeycomb core for your table?

b)  Plasticore just got an order from the Aquaturf for 80 tables that measure 15’ in diameter. What is the total cost for the honeycomb cores used to build the 80 tables?

c)  Since The Plasticore Corporation is located in the state of Connecticut, Aquaturf has to pay 6.35% sales tax on the total cost calculated in part (b). Also Plasticore charges a shipping and handling delivery fee of 10% of the pre-tax cost.  Calculate those two extra fees and find the final total cost of the Aquaturf order of eighty 15 feet diameter honeycomb core tables.

Preparation before the task:


Before students are given the performance task we do a little preparation (yes of  course there are all the lessons of this unit but also...) with a honeycomb exploration. 

Honeycombs are a network of hexagons that bees create for their hives. They are a wonderful natural shape because they efficiently use material for the amount of area they create and they are strong. This task has you creating a network of honeycombs.

Work with your group to create the following honeycomb stages on hexagonal grid paper. You should have 5 different color pencils, markers or highlighters.  Let’s see how a honeycomb shape can be built starting with a single hexagon and building out.

PART ONE:

1A)  The center of your honeycomb is the black hexagon in the center of your grid paper.  For stage one, choose a colored pencil and color all the hexagons that touch the black hexagon.  How many hexagons did you color for stage 1?  Enter this number into the table below in the “Number of Hexagons Added” column. 


1B)  For stage two, choose a different pencil and color all the hexagons that touch a stage 1 hexagon.  You should now have two “rings” of hexagons colored.  How many hexagons did you color for stage 2?  Again, enter this number into your table in the “Number of Hexagons Added” column. 

1C)  Now choose a different color and color all the hexagons around this first layer you did. Enter this number into the table for stage 3. Continue this coloring method & recording for stages 4 & 5. 


Students then create a visual pattern with colors that they investigate using what they know about sequences. Everything is detailed in the document honeycomb patterns.


Once they've got all that (they do this in small groups and compare results, tweaking as they go). They are ready for the performance task.

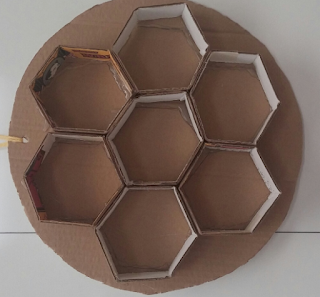
We talk through the scenario. And I show them a model of a honeycomb core "table" that I made (with corrugated cardboard, an xacto knife and glue gun).


This model has an accompanying circular "cover" so they can see how the table has the core in it to stabilize and strengthen the table.

Then they are on their own to complete all the parts of this task. We do focus on the mathematical standards of "Make sense of problems and persevere in solving them", "model with mathematics" and "look for and make use of structure". Especially the perseverance piece. So there is no more classtime for this task, they are on their own and the rubric has a 4 point score for perseverance. (we've had a problem with students "not trying" so this motivates them to really use all the tools available to them and persevere!). 

All documents are found here

Saturday, September 5, 2015

Algebra One Explicit Rules for Arithmetic Sequences

About 4 years ago we started to adopt the common core curriculum. At the high school level we started with Algebra One. It was a pretty crazy year but we got through it. One of the crazy learning expectations was that students would be able to create an explicit rule for both Arithmetic and Geometric sequences. It made me laugh out loud to see how we were supposed to do this with 8th & 9th graders. All the materials I read made it sound like students would intuitively develop the formulas just from examining sequences and recognizing regular behavior. hahahhahha. right. The first year I even tried to develop the formulas the usual way (that I've done for years in PreCalculus)

Nope, didn't stick. My students just did their best memorizing the formula.
Well finally I thought about - what do students already know? Yes in 8th grade they did learn about rate of change, slope and the slope intercept equation. And arithmetic sequences are linear. So I decided to use what they already know to develop explicit rules for arithmetic sequences


We started by graphing the sequence (took some time for students to figure out how to do this since they were only single number values and not ordered pairs).

Then we discussed how it appears to be linear. I did ask them should we connect the points to actually make a line (why isn't this continuous?). Then we talked about how we could write an equation for this line. They remembered rate of change really well and could tell me what it was from the graph. They were a bit puzzled at first on how to find the y-intercept. But they then used the slope to get to the y-axis. We did a bunch of these graphically. They were really liking it and were very good at finding the explicit rule.

But then I told them they should be able to do this without graphing - how can we do that? Students discussed this amongst themselves and came up with a method of doing this. Basically the sequence is "built" by adding the common difference. So if we do the opposite of the common difference we can get to the 0th term. Pretty cool. About half the class really got this. So those kids did really well on the homework. With some more examples for students to work through the next day I think they've all got it now.

Much better than that standard arithmetic explicit rule formula.

Tuesday, August 11, 2015

Quadratic Data (Algebra One)

http://www.ats.ucla.edu/stat/mult_pkg/faq/general/y6.png


This was the last topic we had time for in our Algebra One quadratics unit. We did not manage to get to the discriminant anywhere, something I wanted to do but as we sketched out the end of the year I realized we just wouldn't have time.

We also didn't have time for a performance task, or a unit test. We just did quizzes and one big quest halfway through. And we had the final exam to prepare for.

Here is my lesson plan for introducing quadratic data:

Working with Data – Quadratic Functions


Objectives
Students will be able to
·         Apply quadratic regression analysis to data sets and analyze the data with the resulting equations.  They will do interpolation, extrapolation, find minimum or maximum values and intercepts – relating all to the problem situation. (same objectives over the entire lesson)

What will students do to learn this?
First Day:
·         Start class with quiz on vertex form
·         Activity  HIV data. Discuss – emphasis is on visualizing quadratic data and what it means in terms of a trend, creating a graph (both by hand & on calculator) and understanding the significance of the maximum value.
·         ISN insert – finding characteristics on the calculator
·         Considering a visual parabola:

 measuring a tunnel example (on ppt) – with provided scenario students will
a)    Input the data into their graphing calculator and draw a rough sketch of their graph (label axes)
b)    Write a quadratic function equation f(x) for the data (use STAT CALC #5).
c)    What is the R2 value and what does this tell you about the fit of the function to the data?
d)    What is the vertex of this graph? What does it represent in this problem situation?
e)    Interpolation – Calculate f(4) and explain what your result means with respect to the problem situation.
f)     Extrapolation – Calculate f(10)  and explain what your result means with respect to the problem situation.
g)    What is the y-intercept of this graph and what does it represent?
h)    What is the positive x-intercept of this graph? What does it represent?

 Second day - work with data sets 

Here is the ISN insert
next year I want to do a "right hand reflect" example opposite this. 


And this folder has all my ISN templates for this unit (8 blog posts worth! I'll post this link on each blog). It's way easier to upload them all together.

Here are supportingmaterials I used for this topic. 

Monday, August 10, 2015

Quadratics and Vertex Form (Algebra One)

The last form for us to go over is vertex form. It's probably one of  the easiest forms to work with as long as you are comfortable with the square root method of solving equations.

We started with an investigation worksheet - function equations shown in both standard & vertex form. They calculate the vertex from the standard form and then answer questions comparing the two forms.

We didn't get to converting standard form into vertex form using completing the square, but we did convert. We found the vertex using the old "-b/(2a)" formula and plugged that into the vertex form template and inserted the leading coefficient in for "a" in the equation. Really easy method, builds on something they already know. Oh well, sorry about skipping over completing the square (no time!).

Here are my ISN inserts


And this folder has all my ISN templates for this unit (8 blog posts worth! I'll post this link on each blog). It's way easier to upload them all together.


Here are supporting materials I used for this topic.