


So what's this incredible project? Students draw a picture on their graphing calculator using functions they've learned and restricting the domains (essentially creating piecewise functions on their calculators). By the time students are in PreCalculus they have learned all the basic parent functions. By December we've reviewed all those types (& have just started graphing sine, cosine & tangent) and reviewed transformations. The bare minimum requirement of this project is to use 10 equations and three function types. As you'll see in my rubric the minimum only results in a maximum grade of a C. I tell students they should aim for about 40 equations. And they should realize and plan for the fact that this project can take anywhere from 8 to 20 hours. And that the "write up" can take 2 hours on its own. My students are terrible at time management, waiting until the last minute to do most things. That will not work with this project. It takes a lot of time and most students have to have me transfer their images from their calculator to the computer with my trusty old graph link (although they can do it themselves with the cord that comes with the new calculators and some software from TI).

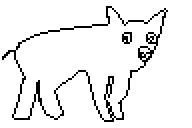
So I had the idea to have students do this while sitting in a really boring professional development worksheet many years ago (like 10 years ago) so started playing around on my graphing calculator and came up with Bob the Dog:

I was pretty proud of myself, but of course after 10 years of seeing fantastic pictures done by students this is not a really a great picture. Oh well. I am so impressed by what students have done and it's time to share in a blog post.
At this point, everyone knows this project is coming up in PreCalculus. So in early December I get them started. I tell them to find a horizontal image they would like to draw. They need to print out this image in the size of 7.5 inches by 5 inches. And I show them this fish as an example:
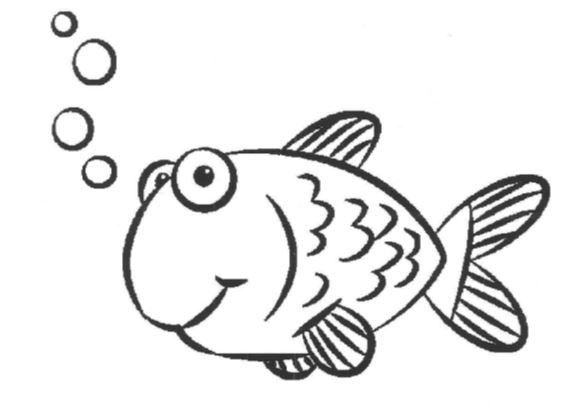
I give students a few days to come in with a picture and then we spend about 30 minutes going over how to start the project. I did my "Bob The Dog" freehand without this step but students prefer to have a starting point and this is a great way to get started visualizing how to transfer an image to a coordinate plane and then their calculator. They trace their image onto graph paper that has a [-15,15] by [-10.10] "window". This will match the square window they will use on their calculator [ZOOM] 5:ZSquare.

From there they look at the image and work with a major shape part of it (like the top of the fish) and consider what functions they would use to create those lines. I remind them of the general transformation form of any function y = a (x - h) + k and of the many parent functions they've studied in Algebra 2 and PreCalculus.
We don't devote any full class blocks to working on this and we still have regular lessons going on. I do give them the day before Christmas break to work on it in class. And I am available to help after school. Some students do this entirely on their own, some need 10 minutes of help getting started, some need an hour of one-to-one help to get started. But everyone comes up with a cool picture!
Students also have to do a write up of their work. This is time consuming too! But they do a great job. I've included files below that have the rubric and project info, tips for the project, a sample student write up and a powerpoint of images submitted by students over the years (oh about 50 or so slides).


They are not that difficult to grade. I've gotten the rubric down to a very quantitatively calculated grade with only one piece that can vary according to "creativity".
After they are all collected and graded I print out everyone's final pictures and create a graphing calculator gallery in the hallway for the school to enjoy. I invite school officials, the superintendent and the members of the board of education to stop by and see the gallery. It really is impressive.


Probably the best part of this project is how much students like it. They all say it takes a lot of time but they learned a lot and really enjoyed working on it! Yay, success!


Go to all documents related to this project HERE.


This comment has been removed by the author.
ReplyDeleteThese are amazing! So talented!!!
ReplyDelete