The stage has been set! We've learned about angles as rotations, we've visualized trig ratios of those angles, we are thinking in radians and we've made a connection between the circular (Ferris wheels) and the sinusoidal shaped graphs. Time to get serious and do Sine, Cosine, and (for some variety) Tangent.
I start by drawing a circle on the board with students fill in for me the angles and the ordered pairs along each axes.
Then I set up a set of axes to go with this unit circle. The x-axis is the angle and the y-axis will be our trig values. I'm sure to use the language of "independent variable" and "dependent variable" to help them make the connection with function work they did back in Algebra One. I also ask them what the maximum sine value is and the minimum sine value (and thus the range).
From here I give each student group a whiteboard marker and one student from each group goes up one at a time and takes a point from the unit circle and marks its location on the coordinate plane. Starting with (0, 0) and rotating around to (2pi, 0). Then someone uses a marker to connect all the data points to make a nice smooth sinusoidal curve.
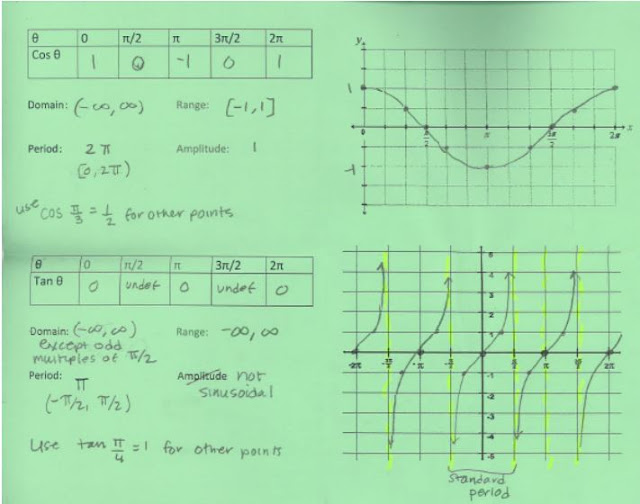
We do this again for cosine. Then we do something similar for tangent with very different results. With tangent we get to talk about what "undefined" looks like on a graph and how can we get more points (pi/4 is a good reference angle to use with tangent). I wish I had taken pictures of the students' work on my whiteboard.
It was great to get them all out of their seats and being involved in the construction of the sinusoidal curves. They knew sine and cosine had these curved graphs but with this they could see how they were constructed. *side note I have in the past tried more creative and involved ways to make the connection between the unit circle and the sinusoidal curve from use uncooked spaghetti to a simulation on the graphing calculator. But this simple "student out of their seats, everyone contribute" basic drawing approach is so nice and clear and concise. Not fancy but really does the trick!
After all this drawing and discussing students fill in a foldable for their ISN.
This is my fancy space saving four square fold. You can see above there are two on this page. The graphing one opens up showing two squares to this:
and then opens up to four squares to show this:
Students use our classroom experience to fill in these foldables in their small groups as I walk around and prod them along but mostly listen to really cool conversations about trig and graphing.
Now since I have an 82 minute block I use about 15 minutes at the end to quickly review transformations and relate them a bit to these functions. I do this with a foldable that we also put on the graphing page. Another "modified" 4 square fold. Transformations should be review but they have some trouble with the horizontal stretch and compress action especially as it interferes with seeing the true nature of the right/left shifts if they occur in the same function.
the transformation unfolds to this "two square":
Which actually have four little vertical doors that we cut. And under each door there is information on what a, b, c & d represent. We don't have much time to talk about these and mostly students copy the information on the foldable as I display it with the document camera.
My textbook has some good basic problems that dabble with characteristics and transformations so I give them a bunch of those to work through.
All my graphing trig functions files are HERE (everything - a bunch of lesson materials, ISN materials, etc).


No comments:
Post a Comment