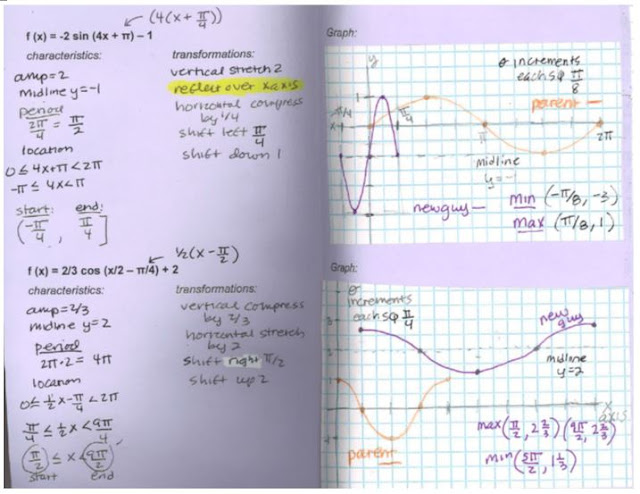
Next we spend time playing around with graphs of sine and cosine. I work on developing some "number sense" and use a somewhat intuitive approach to graphing by combining what we know about the characteristics of the graphs.
We do a bunch of examples together - do these in our ISN:
We do a lot of graphing with all sorts of variations on transformations. Before graphing we list the transformations and characteristics and use them to plan our graph space. I use the midline, amplitude and the period start & end to determine the boundaries of the "single period" of the new transformed function. I like to show the parent function graph on the same graph too so we can see how it changed. We show one period but I continually remind them that this is only one of an infinite number of periods and we are just showing where the initial period from the parent [0, 2pi) ends up after the transformations.
Years ago I learned a cool technique of finding the start & end of a period when there is both a right/left shift AND some type of horizontal stretch/compression. We set up a compound inequality with the standard boundaries of 0 & 2pi. And we put the "argument" in the compound inequality. Then we solve the inequality. Which applies the two transformations to the boundaries of the standard period showing us where the new transformed period starts & ends. See my examples below.
Here are two examples we put in our ISN. My files below have many other examples.
All my graphing trig functions files are HERE (everything - a bunch of lesson materials, ISN materials, etc).


No comments:
Post a Comment