Monday, December 14, 2015

Winter Estimation Fun

Last summer I found a cool website called Estimation 180 and used an estimation activity with a quarter cup of almonds with my classes. A neat little activity to get them thinking.

Here's another one that would be fun to do on that half day before our Christmas break. Ultimately everyone gets a mug of hot chocolate at the end.

How Much Hot Chocolate is in the Glass?  

I could do this with heat proof paper cups and give everyone a cup and pose that question. 

Then we extend the estimate to marshmallows...

How many small marshmallows will fit?

Of course we'll need to discuss what that means. How many fit on the surface? How many fit to fill the mug completely? 


and finally

How many large marshmallows will fit?

some discussion about what this means.

Kids record estimates - can use his site or? create a spreadsheet or survey for my classes?

Finish up with drinking hot chocolate!

NOTE to self - bring in hot water kettle, canister of hot chocolate powder, cups, small marshmallows, large marshmallows. Yum!


Monday, November 9, 2015

Domain & Range Tool

I blogged about this domain & range tool a bit in a post this summer  but today I used it in the classroom and it was really great and I wanted to share this again with updated pictures to show how it worked out.

Domain and range from a graph can be quite tricky. I do this with my advanced algebra one group. This domain & range finder tool is a great way to visualize the domain & range.

They did have some homework last night that involved identifying which graphs are functions and trying to determine the domain & range of each (we had already defined domain & range and even filled in the DIX ROY bit the last class). Most kids came in to class today saying they didn't understand the homework. After going over homework we created our domain & range finder tool.

This tool can be a little "fussy" and I warned the students that today is a bit "artsy-craftsy". I really avoid doing anything too complicated with my foldables - there is the danger of it becoming a folding-cutting class rather than an algebra class. So I prepare quite a bit ahead of time. And I time the cutting and folding tasks to be done while I check homework and help students out in their small groups so it doesn't take away as much instruction time.

I also prepped by photocopying and doing some preliminary cutting with my paper cutter - so worth the time investment.

First everyone gets a pre-cut domain & range finder tool (we only have to fold it):


And an envelope foldable (partially pre-cut) and two strips of domain & range cards (8 cards all together).


We folded the tool and the envelope and glued everything in our notebooks before proceeding.


I walked through three cards with them, showing how to use the tool and how it helps us find the domain & range. So cool. So visual.


They had to finish the other five cards.

Then do the purple graphs on their notebook pages.

Then go back and do the back of the homework (some really challenging ones on that!).

As students worked I displayed answers via my document camera. More practice on a HW worksheet. Quiz next class!

All my documents can be found HERE. 

The original idea comes from math=love http://mathequalslove.blogspot.com/2013/08/algebra-2-interactive-notebook-pages.html - thank you again!  So many wonderful ideas in her blog. And she inspired me to do this blog to share my materials.

Saturday, November 7, 2015

Polynomial Functions part 1

We focus on Polynomial Functions now. This takes a few blocks. First we look at the general shape - identify end behavior & middle behavior (zeros & multiplicity) initially without using a grapher of any type and then verifying with their graphing calculator.

Students start by exploring the first three problems on the intro exploration sheet. Then we discuss anything they noticed (such as how they found the degree, the y-intercept and zeros - all the functions are in factored form at this point).  Then we fill in our ISN foldable about polynomial functions.
inside:


At this point, we've run of time and I have them finish the exploration sheet for homework.

We start the next class with a few warm up problems but then get into the main objective of this lesson which is to be able to describe characteristics of a polynomial function and draw the graph without the use of the graphing calculator. (all the examples we do at this point are factored or easily factorable).

We go through some examples with the right hand reflect page in our ISN.


Then students have a set of problems to work through for homework. I'll also do a formative assessment on this before moving onto Polynomial Functions part 2.

All materials used can be found here. 

Friday, November 6, 2015

PreCalculus Power Functions Unit 2

Now that we've established all the characteristics of functions and various processes used on functions we can now analyze some different function types.

Unit 2 is all about power functions. We cover this initially in a general way, then focus on polynomial functions and rational functions. We don't review quadratics. They saw those plenty in Algebra 1 & 2.

The start of this unit begins right after the unit 1 test. Students have an exploration of power functions to complete for homework after the test.

Students share their generalizations on my whiteboards. Then we fill in our ISN foldable on power functions.


We support this ISN foldable with our "right hand reflect" page being about "Power Function Facts".


And finish off by looking at power regression. We use the TI graphing calculators in class. I give students a instructions sheet that I use in Algebra One. But I remind them that we are looking at power function regression in this class, not linear regression. Finally we do an example with antelope data.

All documents used in this lesson can be found here.

Thursday, November 5, 2015

How my PreCalculus students prepare for Unit Tests

Students are terrible at studying for math. Well, most of them are. I ask them - how did you study? and pretty much the response you get is "I looked over my notes". Arrggghhh.  In my mind, to study for me you have to work through problems. A bunch of problems. In all areas that have been studied. And for a big unit test, it should be a lot of problems and take a good long while to study thoroughly.

My solution to this problem - I have my students make a study guide. They have to find problems (from homework, quizzes, classwork, etc) for each topic. I give them a detailed outline of what they need to do. they get some time in class to do this. And then must finish it at home.

The only new bit I added this year was to have them do the study guide in their interactive student notebooks. I figured, why not. Last year was my first year doing these notebooks in PreCalculus and we only used about half our composition notebook over the year. So we have extra pages. This way their study guide is all together with their reference notes in their ISN. The complete package so to speak.

I do collect the study guide on the day of the test. And they get a completion score (but they have to provide examples that are appropriate for the each topic, wrong type of example=no credit on that topic). It's a participation grade. I don't do separate participation grades for my students. Their participation score is basically the study guides and any graded classwork that I collect. I also tell them that homework is participation.

This year since I had them put their study guides in their ISN I did a "sample" study guide in my ISN. I do not post this sample (they could just copy my problems). But I have it available in my classroom for students to see what the set up would look like for this study guide.

Here are my filled in ISN pages.

and here are my instructions for students about the study guide for unit 1. 

Wednesday, November 4, 2015

PreCalculus Inverse Functions


The final topic in our unit 1 - Inverse Functions.  Again, this is covered in Algebra 2 but we take it that little bit step up.

We start with some "big ideas" behind inverse functions.... It's inverting the original function by "switching the x & y", the graph is a reflection over the line y = x, the domain of the inverse equals the range of the original.

It's the later statement that becomes more of a focus. Because there can be some domain restrictions that result from the original function. I always like to start with a square root function and find its inverse. We really break this down by identifying the domain & range of the original and examining the graph. (I have students find the domain without the graph and then verify and find the range using the graph - we use TI graphing calculators).


Of course students now want to generalize that you just switch the domain & range when describing the domain & range of an inverse. So I have to work through an example that starts with a quadratic. They see that the range of the inverse is not the same as the domain of the original.

And we also get into some funky algebra. That is finding the inverse of a rational function. Something they saw but probably didn't master in Algebra 2. Good algebra skills to develop. Especially since we'll be using them in verifying identities in trig later in the year.

Yes of course, I have an ISN insert for Inverse functions. 


And here is my "right hand reflect examples" for my ISN. 


One thing I need to incorporate in is some more inverse application problems. Ran into a blip this year as I got quite sick so this lesson was covered by a substitute teacher via my powerpoint notes. So it wasn't as good as I would like it and I left out application work. There's always next year!


Tuesday, November 3, 2015

PreCalculus Composition of Functions

Unit 1 in our PreCalculus course is quite long. We cover all kinds of characteristics and general processes that involve functions. Many of what we cover has been covered in Algebra 2 but we take it that step further.

One of the topics we look at is transformation of functions. I start with a general introduction that involves coupons that one can use at Kohl's department store.

Does it matter what order you apply the coupon when you use them together for one purchase?  I pose the question
You spend $50 at Kohl’s and take advantage of these two savings. Does it matter which is applied first?
Then students look at this scenario in a more general way..
Would your result be the same for any merchandise amount?a)  Write a function f(x) for the $10 off with x = merchandise totalb) Write a function g(x) for the 20% off with x = merchandise totalc) Find the function composition f(g(x)) using the two equations above. What does this function represent in the problem situation?
d)  Find the function composition g(f(x)) using the two equations above. What does this function represent in the problem situation? e) Using those two composition functions above, can you definitely say which is the better deal? 
I consider this a pretty basic introduction but want students to realize how composition might be applied in the real world.

The lesson continues with a discussion of what they learned about composition last year in Algebra 2. They are pretty fluent with the idea of composition and creating composition equations. Some get a little stuck with a composition problem such as

And they come up with this.....
Which makes me want to run screaming from the room. I tell students that. The surefire way to freak out your PreCalculus or Calculus teacher. Distribute a power over addition or subtraction. Arrrggggghhh  Or more emotionally powerful you can tell them this
http://mathcurmudgeon.blogspot.com/


We also look at more complicated composition algebra work with some rational functions. They might see this a bit in Algebra 2 but in my class I expect them to be fluent with the algebra necessary to find and simplify this type of composition problem. It's a challenge for some kids.

But then I tell them that the real "precalculus" aspect of composition is what happens with the domain of composition functions. I usually have start with the whole idea of a function box with the input being the domain & the output being the range. (just a quick review on this - many say they never saw the function box visual when learning functions, unless they had me for Algebra One).


http://www.coolmath.com/algebra/15-functions/05-domain-range-01

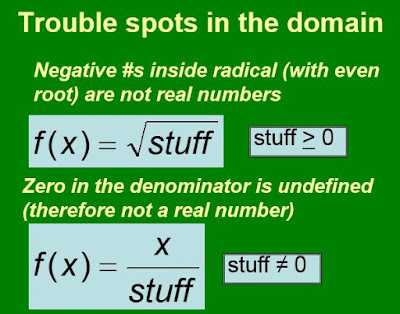
 We review the two "trouble spots" that affect the domain. 

But then we pull this all together to consider the domain of composition. Since there are two function operations there are two instances of "having a domain to draw from". Even though the two function equations are merged together to create one function equation you still have to consider the individual pieces.

A classic example to illustrate that with is

and when they graph it in "un-simplified form" they get


Not what they expected - the expectation is that they would see a full line y = x as the composition equation results in. But I tell students the composition is affected by its two parts and they drive the domain of the composition.

We look at a composition function box:

And we see that there are two potential trouble spots in the domain of f(g(x)). There is the initial domain issues concerning the first application of domain values into g(x). But then you have to be on the lookout for what restrictions f(x) may have. The weird bit here is that these create indirect problems with our domain because any values used in f(x) come from the range of g(x). So we need to see what original domain values result in those range values for g(x) that will create problems with f(x). This is a very tricky concept for my precalculus students. We focus on rational functions mostly when doing these. I haven't done much with other functions. This idea can be summarized with:

We usually do a fair amount of practice here. Students might start to see a shortcut to finding that "second hole" in the domain (in rational functions it ends up being the "hole" in the composition equation). But I expect them to show me the "long way" of finding the restrictions and they can use the shortcut to check their work.

Of course I have some ISN pages for this topic.

cover of foldable:
inside the foldable
right page reflect example that students work through:


 And we do some practice problems with word problem applications. I want students to see how composition is part of the real world and what the meaning of the resulting composition function equation is with respect the real life situation. We don't worry about domain restrictions in these problems.


Saturday, October 3, 2015

Pre-Calculus Transformations

I told my students in class that we are now at a "turning point" in this unit. We have gathered up and learned about all these different properties that functions can have. We have organized our functions into 13 major parent functions. Now we can apply some processes to functions. So the rest of the unit we look at transformations, composition of functions and inverse functions. All topics covered in Algebra 2 that we cover in a bit more detail and a bit more abstractly at times.

This post has to do with how we handle transformations. I assume students remember everything from Algebra 2 and we can move right into more complicated stuff (ha!).

We start by looking at the transformation problem students had on their summer packet.


...of course they were not so strong on this when they completed the summer packet, so we worked through it together in class.

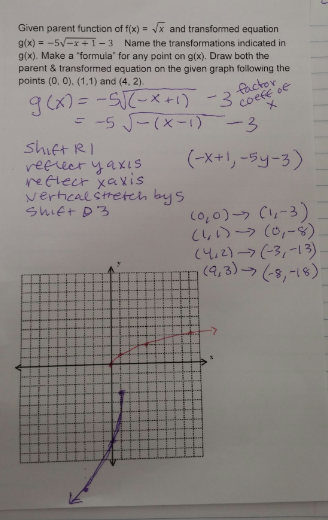
When a function has multiple transformations it can be very tricky to graph. The one above has four transformations. Keeping those 4 transformations in your head and applying them step by step to a point can be difficult. I've seen some teachers have students create a table with the columns representing the transformations and the rows representing the points. The cells in the table show what each points changes to with each transformation. Some of my students would love this but it's really way too time consuming. Instead we create a "formula" to represent the transformations as applied to the parent point (x, y). Then any ordered pair from the parent function can be put into the formula and the new final version of the ordered pair will result.

For example the summer problem example above has the following transformations:


Each transformation affects either the x or y coordinate. We create a formula for those transformations:
Then it's easy enough to identify the new location of the original parent points and create our transformed graph.

After this discussion we create our foldable. Students help identify what each is and what we should write about each.


Then we apply these to an example. This one is a bit tricky because the "horizontal shift" is obscured by the coefficient of x. I stress the important of factoring the coefficient of x (yet keeping it inside the function operation to see the true behavior). I like having both the parent function (usually in red) and the transformed function on the same graph so students can see how they are different relative to each other.


I have a few worksheets that I created for students to do practice work on these skills. They must be able to do this all without a graphing calculator. On homework they can check their graphs on their graphing calculator (graph, then use [TRACE] to check the new transformed points). But they can't use calculators on assessments.

You can find all my files for transformations here (foldables, worksheets).

Wednesday, September 30, 2015

PreCalculus Symmetry (odd, even or neither)

Our final function characteristic is symmetry. This is largely visual at first.


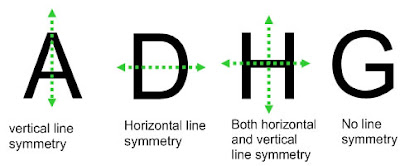
We start off by identifying letters of the alphabet that have vertical line symmetry, horizontal line symmetry and multiple line symmetry. I write those headings on my whiteboard and have students go up and draw examples with the dotted lines of symmetry. (oops forgot to take a picture of this!).


Then we talk about how we can do the same with functions but can't just do any horizontal or vertical line when discussing symmetry. We need a standard horizontal line to be symmetrical to & a standard vertical line to be symmetry. Aha - how about those axes? So then students draw some visuals for both of those - soon realizing that symmetry with the x-axis results in something that is not a function. For multiple line symmetry - we talk about symmetry with respect to the origin (or a double flip to get back to the original - a flip over each axes - helps them visualize it). So we figure out what parent functions appear to be symmetrical and what type they have.

We use a foldable to organize our information in this lesson.


Next is getting the vocab down - we have EVEN and ODD functions. Interesting names, no? Wonder what relevance they have.....


Then nasty little teacher as I am I point out - oh no, remember that we can't take what we "see" at face-value. A visual is not enough to prove anything mathematically. I tell students that we have to verify in a general way algebraically, following a set format. Sort of mini-proof like. Some students get pretty annoyed at this, why do we have to do that? Hey, all I can say is "justify, justify, justify". If I'm not convinced then it's not true.


Of course there is always the student who doesn't believe me when I tell them they must have each part. Sigh. They do. And if they don't it will be reflected in their grade. Sigh. 

My students learn that I am a big fan of shortcuts but I also insist on precision. 

All precalculus foldables are found here