Showing posts with label graphing calculator. Show all posts

Wednesday, January 27, 2016

Graphing Calculator Pictures - PreCalculus Project

Many teachers in our department had projects in their math classes long before the common core curriculum had us having students do performance tasks. I hate grading projects but love having students do them because they show me that they can really apply what they have learned to something interesting and different from what we are able to do in class. I've taught PreCalculus (honors level) for about 10 years and this particular project is sort of like the pinnacle of all the projects I have students do. It's absolutely amazing what students are able to create on their graphing calculator.


So what's this incredible project? Students draw a picture on their graphing calculator using functions they've learned and restricting the domains (essentially creating piecewise functions on their calculators).  By the time students are in PreCalculus they have learned all the basic parent functions. By December we've reviewed all those types (& have just started graphing sine, cosine & tangent) and reviewed transformations. The bare minimum requirement of this project is to use 10 equations and three function types. As you'll see in my rubric the minimum only results in a maximum grade of a C. I tell students they should aim for about 40 equations. And they should realize and plan for the fact that this project can take anywhere from 8 to 20 hours. And that the "write up" can take 2 hours on its own. My students are terrible at time management, waiting until the last minute to do most things. That will not work with this project. It takes a lot of time and most students have to have me transfer their images from their calculator to the computer with my trusty old graph link (although they can do it themselves with the cord that comes with the new calculators and some software from TI).

So I had the idea to have students do this while sitting in a really boring professional development worksheet many years ago (like 10 years ago) so started playing around  on my graphing calculator and came up with Bob the Dog:

I was pretty proud of myself, but of course after 10 years of seeing fantastic pictures done by students this is not a really a great picture. Oh well. I am so impressed by what students have done and it's time to share in a blog post.

At this point, everyone knows this project is coming up in PreCalculus. So in early December I get them started. I tell them to find a horizontal image they would like to draw. They need to print out this image in the size of 7.5 inches by 5 inches.  And I show them this fish as an example:

I give students a few days to come in with a picture and then we spend about 30 minutes going over how to start the project. I did my "Bob The Dog" freehand without this step but students prefer to have a starting point and this is a great way to get started visualizing how to transfer an image to a coordinate plane and then their calculator. They trace their image onto graph paper that has a [-15,15] by [-10.10] "window". This will match the square window they will use on their calculator [ZOOM] 5:ZSquare.


From there they look at the image and work with a major shape part of it (like the top of the fish) and consider what functions they would use to create those lines. I remind them of the general transformation form of any function y = a (x - h) + k and of the many parent functions they've studied in Algebra 2 and PreCalculus. 
     
We don't devote any full class blocks to working on this and we still have regular lessons going on. I do give them the day before Christmas break to work on it in class. And I am available to help after school. Some students do this entirely on their own, some need 10 minutes of help getting started, some need an hour of one-to-one help to get started. But everyone comes up with a cool picture!

Students also have to do a write up of their work. This is time consuming too! But they do a great job. I've included files below that have the rubric and project info, tips for the project, a sample student write up and a powerpoint of images submitted by students over the years (oh about 50 or so slides).
            

They are not that difficult to grade. I've gotten the rubric down to a very quantitatively calculated grade with only one piece that can vary according to "creativity".

After they are all collected and graded I print out everyone's final pictures and create a graphing calculator gallery in the hallway for the school to enjoy. I invite school officials, the superintendent and the members of the board of education to stop by and see the gallery. It really is impressive.
        

Probably the best part of this project is how much students like it. They all say it takes a lot of time but they learned a lot and really enjoyed working on it!  Yay, success!


Go to all documents related to this project HERE. 


Friday, September 25, 2015

Checking Solutions on Graphing Calculator Alg One (revised!)

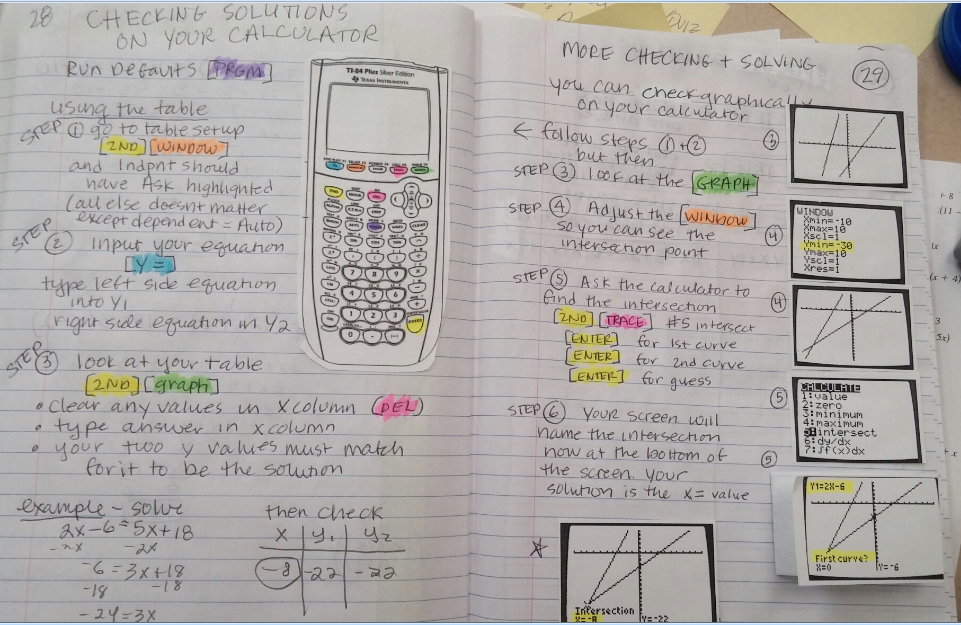
I've done this with my classes over the years. This year I updated my ISN to show this in a more "step by step" manner. It takes a while to go through all these pages and to be sure students are getting it. And it takes patience. It took me 2 classes blocks to do these. After every step I had to check in with each student to be sure they were with me. They would not tell me otherwise unless I checked each person - that's when I found students who were having trouble. Then you have to be super patient and upbeat so they don't get turned off to working with the calculators. For the "technology-generation" I find students can sometimes really struggle with the graphing calculators. Maybe if I tell them it's a phone?

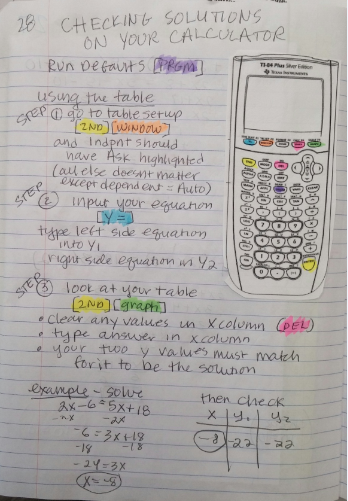
So we ultimately do this 2-page spread. But we do it step by step with students doing the same thing on their calculator.

We've already done a lot of solving and students are quite good at that. And they know how to check a solution by substituting it for a value of x and simplifying.

So we start with the "table method".

As we go through this we highlight the keys we are using corresponding to the highlighted words for the keys in our instructions.

Remember - step-by-step and check everyone as you go.  Patience....

Then we go through the example together. Step by step. I have them write what they see on the table. They won't do this every time they use this method to check. We are just doing it now to confirm what we see. 

Next we check with the graph. Basically checking the point of intersection.

This page involves cutting out fussy little bits for them to glue next to the steps. Thank God for a paper cutter.

The "intersect process" has multi-steps of [enter][enter][enter] so we have an accordion fold set of graphs to show that progression.


Finally I give them the intersection graph to glue in their notebook. I don't hand that out at the start. I want them to get it on their calculator screen first.


Now we revisit those "always true" and "never true" equations we saw earlier. The ones that end up with an "identity" or an "anti-identity" (the later being my made-up word).

They've seen these and have solved and had these as solutions. But this page "formalizes" it a bit and gives them the symbols they can use to show the solution.

We go over how to check that on the graphing calculator. Next year I'll change my examples. The parallel lines are very close together. We had to zoom out to see that they were indeed parallel and not the same line.


A few students in my class do not have graphing calculators at home. But they do have access to computers. So I tell them to go to desmos.com and use their graphing and table functions to check. I wrote up a short basic instruction sheet on how to do that.


Friday, September 4, 2015

PreCalculus Function Basics and the Graphing Calculator

The technology in our mathmatics classrooms are pretty much limited to graphing calculators. We can support our teaching with our LCD player and can occasionally use document cameras and computers (there is a computer lab with 24 computers used by computer science classes but open other blocks for other classes).

There is a lot you can do with graphing calculators. They are a big part of my precalculus curriculum.


Over the years students do regression work and systems of equations and other cool things. There is  a cool project I do with precalculus that involves piecewise functions and creating a picture on their calculator (although they can use a computer equivalent to do this).

A big use of graphing calculators in PreCalculus is to analyze functions.  In Algebra 2 students learned a half dozen or so parent functions and learned about extrema, zeros, & increasing/decreasing intervals. So I start our analysis by refreshing those skills and the use of graphing calculators.

After a warm up quadratic to analyze graphically, we go through a foldable that has little reminders and important things to remember in starting off this basic analysis.

Then students work through an example to apply all these skills.


My expectation is that they already know all this, we're just fine tuning and clearing up any misconceptions. 

And there are always a few students who feel very intimidated by their graphing calculators. So this helps them. I also refer them to my "graphing calculator handbook" that walks them through the whole process of each of this skills (with screen shots to help them visualize what to do). I post this on my school webpage for students to access.

All documents can be found HERE


Tuesday, August 11, 2015

Quadratic Data (Algebra One)

http://www.ats.ucla.edu/stat/mult_pkg/faq/general/y6.png


This was the last topic we had time for in our Algebra One quadratics unit. We did not manage to get to the discriminant anywhere, something I wanted to do but as we sketched out the end of the year I realized we just wouldn't have time.

We also didn't have time for a performance task, or a unit test. We just did quizzes and one big quest halfway through. And we had the final exam to prepare for.

Here is my lesson plan for introducing quadratic data:

Working with Data – Quadratic Functions


Objectives
Students will be able to
·         Apply quadratic regression analysis to data sets and analyze the data with the resulting equations.  They will do interpolation, extrapolation, find minimum or maximum values and intercepts – relating all to the problem situation. (same objectives over the entire lesson)

What will students do to learn this?
First Day:
·         Start class with quiz on vertex form
·         Activity  HIV data. Discuss – emphasis is on visualizing quadratic data and what it means in terms of a trend, creating a graph (both by hand & on calculator) and understanding the significance of the maximum value.
·         ISN insert – finding characteristics on the calculator
·         Considering a visual parabola:

 measuring a tunnel example (on ppt) – with provided scenario students will
a)    Input the data into their graphing calculator and draw a rough sketch of their graph (label axes)
b)    Write a quadratic function equation f(x) for the data (use STAT CALC #5).
c)    What is the R2 value and what does this tell you about the fit of the function to the data?
d)    What is the vertex of this graph? What does it represent in this problem situation?
e)    Interpolation – Calculate f(4) and explain what your result means with respect to the problem situation.
f)     Extrapolation – Calculate f(10)  and explain what your result means with respect to the problem situation.
g)    What is the y-intercept of this graph and what does it represent?
h)    What is the positive x-intercept of this graph? What does it represent?

 Second day - work with data sets 

Here is the ISN insert
next year I want to do a "right hand reflect" example opposite this. 


And this folder has all my ISN templates for this unit (8 blog posts worth! I'll post this link on each blog). It's way easier to upload them all together.

Here are supportingmaterials I used for this topic. 

Thursday, July 30, 2015

Car Comparison Performance Task - Exponential Functions

http://mrec.tv/car/car-comparison.html

Here's a performance task that's a great way to tie in what students know about exponential functions.

Big Idea

Students are given the following task:
Determine if there is a significant difference in value over time for two types of cars by determining and examining their approximate rates of depreciation and using that and other factors to determine which car would be a better value for your needs. 

Setting the Stage

First it's a good idea to brainstorm how students might compare two cars they are interesting in purchasing to determine which is the better deal. Is it enough to compare purchase price? Are there other factors they should be considering? Get a good conversation going, have students list things they should consider on their papers and then share in whole group on the board.

Students have learned about car depreciation in a general way. If they are still uncertain as to what that is you can search on youtube for a possible video to show them. I have students read this article on depreciation. I tell students they are going to compare two types of cars to see which is the better value. They will use depreciation rate as one way of comparing and then choose one other characteristic. We'll have time in class to collect data on the "Kelley Blue Book" site.

Then usually have students then read the article for HW and also read over the performance task details. They are also to think about two types of cars they might want to compare. They might want to compare SUVs and mini-vans. Or two-door sports cars vs 4 door sedans. Or american made vs foreign made. There are a lot of possibilities and encourage them to discuss with their parents about what they think. Students should come in with a general thesis question next class. They do not have to collect data yet or even choose specific makes of cars yet. We'll do that the next class. I also tell students they can work in pairs (this is the ONLY PT they can work together on. I hate having students work together on a graded assignment but every year students beg me to let them do this. And every year there are students who end up doing most of the work for their group who come to me to complain. Sigh. But I figure one PT for them to do together will appease them and it will be less grading for me. I do a big stern talk about being sure you carry your weight if you work in pairs, etc).

Collecting Data

The next class students come in all ready to collect data and start this PT - so we have a computer lab day. Students will collect data on the internet. I have to plan ahead to do this in our school, we don't have many full class sets of computers and I have to be sure to sign up a few weeks ahead of time. Warning - if you have students use ipads to access the site the "tablet" site is a bit different from the general webpage. So be sure you are familiar with what that looks like and how to navigate.

HUGE DISCLAIMER
This can be a little confusing. We really cannot collect true data for calculating depreciation because we can't buy a car and then record its value each year for 5 years. We have about an hour to collect our data. So you have to explain this very clearly and carefully to students so they understand how we are sort of fudging our data but that its still valuable to us even though we aren't truly tracking the value of a single car over time.

What are doing is collecting data on two cars that have been manufactured for at least five years. Students will choose two specific cars, go to Kelley Blue Book (http://www.kbb.com/)  and find the new price of their first car. I strongly recommend that you work through this yourself on the site before you have students do this. My performance task directions are pretty specific but they may redesign their site so things change (and tablet or phone mobile sites look different).

I give students a data collection worksheet to record their data.  They will use tables that look like this:


So the new price goes in for the y-value of "New". Then they look up the price of the same make & model car for the previous year and that goes for the y-value of a 1 year old car (x = 1) and so on with the used car prices. They will use the x values noted in the table when inputting data in their calculator NOT the actual year of the car.

They do this for both cars.

Warning - all sorts of things can happen when students are collecting data. They can find that one of their cars was not manufactured for a given year or that the value is lower for a newer year than an older year. Weird stuff can happen. So you have to think on your feet and decide what they should. Sometimes they have to start over and find another car model.

I know some teachers in my school limit students to a dozen different cars to choose from that the teacher researches ahead of time to be sure the data makes sense for those cars. This is a good idea. I have advanced students so I like them to learn about the quirks and limitations of working with the internet. They are pretty good-natured about having to start over so it has worked out fine for me.

Pulling it All Together

Now students have collected data and they have information about two cars. They need to create a nice table of all their data and get pictures of each of their cars. They should have something like this:


Then they have to apply the algebra they've learned, collect some more information about their cars and pull it all together to make a comparison. See the performance task details to see very specifically what they are doing.

The next class I like to talk briefly about what they do next. They need to have some sort of presentation of their results. They can turn it in as a powerpoint, as a booklet or as a poster. They do not have to present in class. Sometimes I get a pair of students who wants to present their powerpoint and I give them the opportunity as long as they can do it in ten minutes or less. But generally students want to just turn it in. It's a great idea for them to present their results but I'm always am working with time constraints - so much to cover, so little time. Anyhow, I show students this PowerPoint that gives a "sample presentation". I won't post this on line for students to refer to because I want them to have things in their own words but I like them to have a good idea of what makes a good and complete presentation. I don't give students any more class time to complete this task. They have about a week to turn in their final work. 

How I grade this

I have a teacher rubric with details on how I grade this. Feel free to contact me for this and I will send it out to you.


Tuesday, July 28, 2015

Algebra One Unit 7 Exponential Functions

Now we get into the fun stuff!  Applications....

I like to start off by considering a new type of function. A fun way to do this is with a skittles lab (or M&Ms) which I'll detail in my next blog post.

From there we define in a general way exponential functions and then compare linear and exponential functions. We look at the difference between growth & decay. Then we explore additional applications by looking at Half Life, Compounding Interest and Logistic Functions. Also we do some regression analysis of exponential data.

I'm not going to go into a lot of detail on these now as my student teacher covered these topics in 2014-2015 school year. But I will do an update in spring 2016 after I teach it and tweak all my ISN inserts.

For now, here are the inserts my wonderful student teacher used.


 Regression Analysis pages:
first a reminder of how to use the graphing calculator

 then an example:
 Other Applications:

Space was limited in this foldable so next year I'm thinking of creating two two page foldables for these four topics.


Here are some worksheets and lesson materials I used for these topics.