Thursday, February 25, 2016

Applications of Sinusoidal Graphs


My pre-calculus students are now very good at graphing sine and cosine with all sorts of transformations. We've completed our work on inverse functions. So now we are ready to dive into applications of sinusoidal functions.

We start by revisiting the Ferris wheel. This is how I like to introduce sine and cosine graphs this unit (after spending time with the unit circle and rotations it is a great way to see how we get the sinusoidal graph from a circle, see my blog post here for details).

We begin with this scenario:
1     A Ferris wheel has a diameter of 30 m, with the center 18 m above the ground. It makes one complete rotation every 60 seconds.

I have students draw a graph for this, showing one complete rotation. Then I pose the question, what would a sine equation for this scenario look like? How can we go about calculating that? What do we need for our equation?

  We use the standard form of the sine equation and talk about what we can use for values for a, b, c, & d.

    from there students identify the amplitude, the period and the midline. We use the lowest point ( ) to calculate our "c" value. And ta-da we have our sine equation.

    then we use this equation and what we know about the scenario to answer questions:

  
   Here is the work used to calculate these:

   Our next example looks at situations that take place over a year's time (thus fixing the period length to 365 days). We start with this group example:

     Events that are cyclic (or periodic), such as seasonal variations in temperature, can be modeled with trigonometric functions.  Regina is the capital of Saskatchewan, a province in Canada. The average temperature for Regina is hottest at 27o C on July 28, and coolest at -16oC on January 10.


We jump right in to finding the equation for this situation. Again using the basic sine equation and deciding what we already know (period and using the dates and temperatures we can calculate the amplitude and midline). Again we use the minimum temperature to solve for "c". The result is not as perfect as our Ferris Wheel sine equation as the real life data is not as perfect as a perfectly circular Ferris wheel rotating at a constant speed. But it's very close. (you can see the problem with it by calculating the hottest temperature using the equation, it doesn't give you exactly 27 degrees). 

    I like to draw the graph for these yearly events after I have the equation. It's easier to do that than just working with two pieces of data. I can get some other points on the graph with my equation.

Then I have students answer a few questions using the equation.

From here I now have students work on a packet of problems related to those two examples. They work together in small groups and do some problems for homework as well. This packet is used over a two day period. You will see those two class examples embedded in the worksheet (I put them there so there is a hard copy record of them, also my scanned answer key has all the details of "how to" for all the problems. This is helpful for absent students). 

On the second day (or third depending on scheduling etc( we do a little bit of summarizing with some ISN inserts for our notebooks. I have a two page spread where we model two examples. One in which the given information is the description of a scenario:

The second example uses a set of data. We "hand-calculate" the sine equation but then we compare it to the regression equation from the graphing calculator.

I have students attach the problem only on the left margin with tape (both front & back to keep it secure) so they can show the graph on the reverse side. (we don't tape it in until after they draw the graph). We show both our "hand-calculated" graph and the calculator regression graph. Very similar.


At some point I do discuss the difference between the form of the equation we use to create our equation
Versus the equation the TI graphing calculator uses to create the regression equation: 
y = a sin (bx+c)
Two big differences. First the "b" value is not factored out. We always factor out our "b" value to isolate the true "c" value which illustrates the right/left shift in our graph. In the graphing calculator model this shift is obscured by the horizontal stretch/compress action. Also the calculator uses +c and we use -c to indicate the counter-intuitive nature of the right/left shift. 

So what can happen (as seen in the work in the above example) the regression equation can be very similar to our equation in the amplitude and period and midline but be quite different in the "c" value. Even if you factor out the value of b. This comes from the fact that the calculator zeroed in on a different "standard period" than we did in our calculations. Basically my understanding is that a sine equation transformations indicate what transformations take place on the parent function of sine with the basic period of 0 to 2pi. It show where the "new standard period" shifts to. Our lines are very close, we just have different "new standard periods".  Hope this makes sense!

And finally we wrap things up with a performance task that has students collect data on number of daylight hours at various latitudes. The project introduction reads:
In this project you will develop equations and apply sinusoidal functions that model the number of hours of daylight for locations in the world at different latitudes. To study the relationship between latitude and the number of hours of daylight, data will be collected and analyzed. Using the example of the number of daylight hours, you will then investigate other sinusoidal phenomena.

This will be the second year I am using this project. It is a bit time consuming so I do give them some time in class to get started. Then students need to manage their time well to complete the project. I warn them it's a bit involved so not something they should leave until the night before it's due to work on (as so many seem to do!).


This link will bring you to all my graphing sinusoidal function files including applications. 


Wednesday, February 17, 2016

Inverse Trig ISN and Evaluate

We set the stage with our "exploring inverse trig functions" and now we move into how we use them in this course. We take a few minutes at the start of class to summarize what we learned with the explore by filling in a little ISN booklet of three pages (one each for sine, cosine & tangent):


Recall that you can "undo" any trig operation with its inverse to find the angle (such as in solving right triangles or other triangle application problems). What I am asking students to do now is to find the range value for a given domain value of a trig inverse function. 

Very subtle concept here. Students have to be very solid with their trig ratios to be successful here. Basically what we are doing is finding the angle when we are given the ratio. This can be very difficult for some students.

What I do is go over a few problems with them such as


and refer to the unit circle visuals for the inverse trig function


I remind them that the domain of the inverse (for sine & cosine) is very limited. We can only evaluate values between [-1, 1]. When the ratio is negative I ask them questions to help them remember that the original sine ratio is the y-coordinate in the function and where is the y-coordinate negative in the restricted unit circle visual?

Basically students came up with these "thinking steps" for evaluating:
1) look at the ratio - what special or quadrantal angle results in this ratio?
2) now be careful - what is the sign of the ratio? If it's negative think about which inverse trig ratio we are using and where the negative ratios reside in the "unit circle connection" we drew above. Use that to determine the angle.

I also ask,
 "which inverse trig ratios can have negative angles in their domain? which can only have positive angles in their domain?"

I like to keep them thinking with this one

(I ask them "what is the domain of arcsine?".....and what is the numerical value for pi?)

After a few examples students practice "how to evaluate" inverse trig ratios with this foldable:


And then I work through a few "double evaluations" such as:
        

You've got to be careful with the second one as the inverse doesn't always just undo the operation with the result being the given angle. 

And then to keep them on their toes I give them one of these. All kinds of confusion zings around the room as students try to remember what special angle has that trig ratio. When I confirm that there isn't one, I tell them that we really don't need to know the angle. We are ultimately just finding the trig ratio for cosine of some mystery angle. 

with some prompting the hope is that someone will remember that the tangent ratio is y/x and the cosine ratio is x/r so all they need to do is figure out r with the Pythagorean relationship for x, y & r.

Finally students use this foldable on the page opposite to practice these evaluations.

this double evaluation goes on top of the evaluation page - I glue the evaluation page onto the notebook page and this page gets taped across the top creating a little flap over the evaluation page. 

I also have a worksheet of practice for students. Preview of first few problems:


All my files on Inverse Trig Functions can be found HERE (and this is everything - introduction sheets, evaluate sheets, ISN materials, answer keys)

Thursday, February 11, 2016

Introducing Inverse Trig Functions


So I've been reading a bit about inverse trig functions on line and how people approach teaching them. It got me thinking about what my focus is with inverse trig functions and inverse functions in general in PreCalculus. My thinking is that students in Algebra 2 learn about inverse functions and the mechanics of inverse functions (how to create graphs, how to create inverse function equations, what they mean in terms of real life situations). PreCalculus is a time to dissect the idea of inverse functions more deeply in a bit of a more theoretical way. Are there limitations to the inverses of functions? Is every inverse of a function a function itself? We explored these questions back in the fall and it was hard for students. I have a good set of classes, honors level but they have been used to learning processes and procedures and not really developing a deeper understanding.

I like to start out these lessons on inverse trig functions by having a discussion about the difference between inverse operations and inverse functions.  This sort of maps out our discussion (I lead the discussion with questions - what is an operation? what is the inverse of that operation? Let's consider an operation we all know pretty well - "squaring" - what does that look like as an operation? as a function? as an inverse operation? as an inverse operation?).

Then I steer the discussion to trig ratios as operations, as functions, etc. I try to do this by asking as many questions as possible.

Then after the discussion I distribute an "explore" packet to students. We do the first page together (it's just a review of inverses with quadratics and the domain & range restrictions). Then students work together in their small groups and using their graphing calculators work on visually representing  and defining domains and ranges of inverse trig functions.  I put a big focus on the visual (it's how I learn best and I find students often learn better that way too),

I thought I'd visually go through what we do & students do with the explore packet. You can open a blank electronic version of this worksheet at the end of the post.

We use TI-84 or TI-83 graphing calculators. We graph a basic quadratic and state the domain & range:


Then using the DRAW menu we can actually see the true inverse without restrictions of this function. We do that and draw it. Discussion ensues with "what's wrong with this picture?"

From there we remember that the inverse of the quadratic is the square root function. We draw that. We carefully examine the graph and the function equation to be clear about the domain and range. 

A little "mantra' we chant is the the domain of the inverse comes from the range of the original. This is verified and we see how it restricts the range. All this is review of something we did back in the fall.

Now students get to work on their own doing a similar process to sine, cosine and tangent. These bits below show ideally what they should be coming up with. If there is time I have three small groups present what they come up with for each and explain. Then I lead the discussion into how these relate to the unit circle. That will continue in my next post (we pull it all together in some ISN inserts).

SINE:


COSINE:


TANGENT:


Is this good math teaching? I hope so. I just remember when I first started teaching PreCalculus 10+ years ago. I was equipped with my previous learning as a precalculus student many many years previous and a bunch of textbooks. No real curriculum. When I got to inverse trig functions I had to ask myself - what are these really? What do I want to know about them? How can I make sense of them in relationship to everything else I know about mathematics? I have a hard time using problem sets in textbooks to drive my teaching. I like having a deeper understanding of how things work rather than just know how to solve given problems.

We do then go onto apply these ideas to problems. But I'd like to think of another way to assess understanding than just evaluate inverse trig functions. Maybe some writing prompt for the students to respond to.

All my files on Inverse Trig Functions can be found HERE (and this is everything - introduction sheets, evaluate sheets, ISN materials)

Monday, February 8, 2016

Graphing Trig Functions part 2


Next we spend time playing around with graphs of sine and cosine. I work on developing some "number sense" and use a somewhat intuitive approach to graphing by combining what we know about the characteristics of the graphs.

We do a bunch of examples together - do these in our ISN:


We do a lot of graphing with all sorts of variations on transformations. Before graphing we list the transformations and characteristics and use them to plan our graph space. I use the midline, amplitude and the period start & end to determine the boundaries of the "single period" of the new transformed function.  I like to show the parent function graph on the same graph too so we can see how it changed. We show one period but I continually remind them that this is only one of an infinite number of periods and we are just showing where the initial period from the parent [0, 2pi) ends up after the transformations.
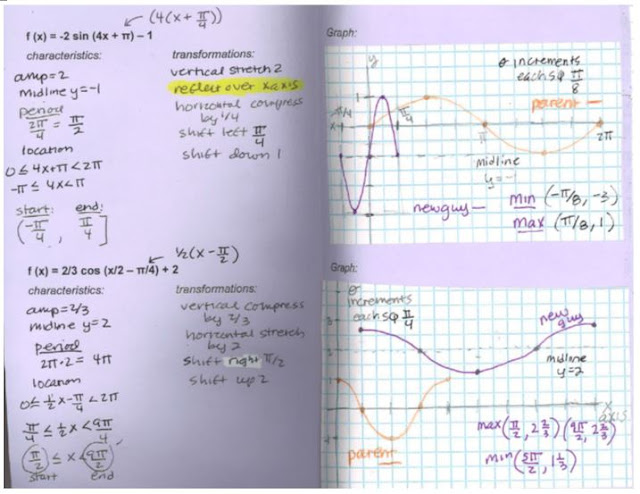
Years ago I learned a cool technique of finding the start & end of a period when there is both a right/left shift AND some type of horizontal stretch/compression. We set up a compound inequality with the standard boundaries of 0 & 2pi. And we put the "argument" in the compound inequality. Then we solve the inequality. Which applies the two transformations to the boundaries of the standard period showing us where the new transformed period starts & ends. See my examples below. 

Here are two examples we put in our ISN. My files below have many other examples.


All my graphing trig functions files are HERE (everything - a bunch of lesson materials, ISN materials, etc). 

Sunday, February 7, 2016

Graphing Trig Functions part 1


The stage has been set! We've learned about angles as rotations, we've visualized trig ratios of those angles, we are thinking in radians and we've made a connection between the circular (Ferris wheels) and the sinusoidal shaped graphs. Time to get serious and do Sine, Cosine, and (for some variety) Tangent.

I start by drawing a circle on the board with students fill in for me the angles and the ordered pairs along each axes.

Then I set up a set of axes to go with this unit circle. The x-axis is the angle and the y-axis will be our trig values. I'm sure to use the language of "independent variable" and "dependent variable" to help them make the connection with function work they did back in Algebra One. I also ask them what the maximum sine value is and the minimum sine value (and thus the range).

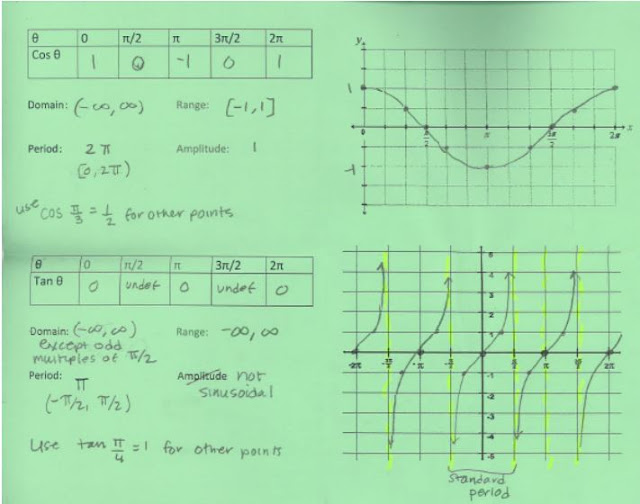
From here I give each student group a whiteboard marker and one student from each group goes up one at a time and takes a point from the unit circle and marks its location on the coordinate plane. Starting with (0, 0) and rotating around to (2pi, 0). Then someone uses a marker to connect all the data points to make a nice smooth sinusoidal curve.

We do this again for cosine. Then we do something similar for tangent with very different results. With tangent we get to talk about what "undefined" looks like on a graph and how can we get more points (pi/4 is a good reference angle to use with tangent). I wish I had taken pictures of the students' work on my whiteboard. 

It was great to get them all out of their seats and being involved in the construction of the sinusoidal curves. They knew sine and cosine had these curved graphs but with this they could see how they were constructed.  *side note I have in the past tried more creative and involved ways to make the connection between the unit circle and the sinusoidal curve from use uncooked spaghetti to a simulation on the graphing calculator. But this simple "student out of their seats, everyone contribute" basic drawing approach is so nice and clear and concise. Not fancy but really does the trick!

After all this drawing and discussing students fill in a foldable for their ISN.

This is my fancy space saving four square fold. You can see above there are two on this page. The graphing one opens up showing two squares to this:


and then opens up to four squares to show this:


Students use our classroom experience to fill in these foldables in their small groups as I walk around and prod them along but mostly listen to really cool conversations about trig and graphing. 

Now since I have an 82 minute block I use about 15 minutes at the end to quickly review transformations and relate them a bit to these functions. I do this with a foldable that we also put on the graphing page. Another "modified" 4 square fold. Transformations should be review but they have some trouble with the horizontal stretch and compress action especially as it interferes with seeing the true nature of the right/left shifts if they occur in the same function.

the transformation unfolds to this "two square":
Which actually have four little vertical doors that we cut. And under each door there is information on what a, b, c & d represent. We don't have much time to talk about these and mostly students copy the information on the foldable as I display it with the document camera.

My textbook has some good basic problems that dabble with characteristics and transformations so I give them a bunch of those to work through.


All my graphing trig functions files are HERE (everything - a bunch of lesson materials, ISN materials, etc). 

Saturday, February 6, 2016

Introduction to Sinusoidal Graphs


Ever since I started teaching PreCalculus 10+ years ago I have used Ferris wheels to introduce sinusoidal functions. Well not real Ferris wheels, although that would be really cool. But the idea of them. And we do have a little discussion about Ferris wheels in general and it's interesting to see that there are a handful of students who just don't like them. huh.

Anyhow - way back when I started teaching PreCalculus I found in this book Functions Modeling Change (but an earlier edition) the Ferris Wheel approach. Very cool. 

So I start off the discussion with a few PowerPoint slides. The one you see above is projected as students come in. Then we use ...


I actually went on the London Eye about 5 years ago. Very cool. And sometimes I have a student in my class who has been too.

Then I tell the class - okay make a graph of the height of a person on the Ferris wheel with respect to the time (in this case minutes). They work in their small groups and come up with nice sinusoidal graph. Wish I had taken pictures from my whiteboards of what they came up with. 

From here we have a discussion of periodic and sinusoidal graphs. We define those terms. we talk about characteristics and students work with more Ferris wheel scenarios. We look at some variations in the location and the height of the loading platform. Of course times and diameters change too. It's a great way to get students to think sinusoidally, relating to something they have experience with.

We use this foldable in our ISNs for periodic functions:

The four doors on the bottom two-thirds of the foldable open up:


After students do a bunch together (we have 82 minute blocks) we summarize with this example on an ISN foldable. I have students do the front and the second inside page.


The next class we focus on finding the height at certain times. This can be very confusing and difficult for students but I like how it pulls in the circle and some trig (we stay in radians). We usually end up doing a whole block of problems I make up for various Ferris wheels.


All this preliminary work gets students ready to work with the more abstract and general sine and cosine graphs.

All my graphing trig functions files are HERE (everything - a bunch of lesson materials, ISN materials, etc).