Showing posts with label applications. Show all posts

Thursday, February 25, 2016

Applications of Sinusoidal Graphs


My pre-calculus students are now very good at graphing sine and cosine with all sorts of transformations. We've completed our work on inverse functions. So now we are ready to dive into applications of sinusoidal functions.

We start by revisiting the Ferris wheel. This is how I like to introduce sine and cosine graphs this unit (after spending time with the unit circle and rotations it is a great way to see how we get the sinusoidal graph from a circle, see my blog post here for details).

We begin with this scenario:
1     A Ferris wheel has a diameter of 30 m, with the center 18 m above the ground. It makes one complete rotation every 60 seconds.

I I have students draw a graph for this, showing one complete rotation. Then I pose the question, what would a sine equation for this scenario look like? How can we go about calculating that? What do we need for our equation?

  We use the standard form of the sine equation and talk about what we can use for values for a, b, c, & d.

    from there students identify the amplitude, the period and the midline. We use the lowest point ( ) to calculate our "c" value. And ta-da we have our sine equation.

    then we use this equation and what we know about the scenario to answer questions:

  
   Here is the work used to calculate these:

   Our next example looks at situations that take place over a year's time (thus fixing the period length to 365 days). We start with this group example:

     Events that are cyclic (or periodic), such as seasonal variations in temperature, can be modeled with trigonometric functions.  Regina is the capital of Saskatchewan, a province in Canada. The average temperature for Regina is hottest at 27o C on July 28, and coolest at -16oC on January 10.


We jump right in to finding the equation for this situation. Again using the basic sine equation and deciding what we already know (period and using the dates and temperatures we can calculate the amplitude and midline). Again we use the minimum temperature to solve for "c". The result is not as perfect as our Ferris Wheel sine equation as the real life data is not as perfect as a perfectly circular Ferris wheel rotating at a constant speed. But it's very close. (you can see the problem with it by calculating the hottest temperature using the equation, it doesn't give you exactly 27 degrees). 

    I like to draw the graph for these yearly events after I have the equation. It's easier to do that than just working with two pieces of data. I can get some other points on the graph with my equation.

Then I have students answer a few questions using the equation.

From here I now have students work on a packet of problems related to those two examples. They work together in small groups and do some problems for homework as well. This packet is used over a two day period. You will see those two class examples embedded in the worksheet (I put them there so there is a hard copy record of them, also my scanned answer key has all the details of "how to" for all the problems. This is helpful for absent students). 

On the second day (or third depending on scheduling etc( we do a little bit of summarizing with some ISN inserts for our notebooks. I have a two page spread where we model two examples. One in which the given information is the description of a scenario:

The second example uses a set of data. We "hand-calculate" the sine equation but then we compare it to the regression equation from the graphing calculator.

I have students attach the problem only on the left margin with tape (both front & back to keep it secure) so they can show the graph on the reverse side. (we don't tape it in until after they draw the graph). We show both our "hand-calculated" graph and the calculator regression graph. Very similar.


At some point I do discuss the difference between the form of the equation we use to create our equation
Versus the equation the TI graphing calculator uses to create the regression equation: 
y = a sin (bx+c)
Two big differences. First the "b" value is not factored out. We always factor out our "b" value to isolate the true "c" value which illustrates the right/left shift in our graph. In the graphing calculator model this shift is obscured by the horizontal stretch/compress action. Also the calculator uses +c and we use -c to indicate the counter-intuitive nature of the right/left shift. 

So what can happen (as seen in the work in the above example) the regression equation can be very similar to our equation in the amplitude and period and midline but be quite different in the "c" value. Even if you factor out the value of b. This comes from the fact that the calculator zeroed in on a different "standard period" than we did in our calculations. Basically my understanding is that a sine equation transformations indicate what transformations take place on the parent function of sine with the basic period of 0 to 2pi. It show where the "new standard period" shifts to. Our lines are very close, we just have different "new standard periods".  Hope this makes sense!

And finally we wrap things up with a performance task that has students collect data on number of daylight hours at various latitudes. The project introduction reads:
In this project you will develop equations and apply sinusoidal functions that model the number of hours of daylight for locations in the world at different latitudes. To study the relationship between latitude and the number of hours of daylight, data will be collected and analyzed. Using the example of the number of daylight hours, you will then investigate other sinusoidal phenomena.

This will be the second year I am using this project. It is a bit time consuming so I do give them some time in class to get started. Then students need to manage their time well to complete the project. I warn them it's a bit involved so not something they should leave until the night before it's due to work on (as so many seem to do!).

This link will bring you to all my graphing sinusoidal function files including applications. 


Wednesday, September 9, 2015

PreCalculus Modeling

After establishing the parent functions in PreCalculus we take a little side trip to explore modeling.


Students had the Norman Window problem to do this summer as part of their summer prerequisites packet. Everyone (predictably) had a difficult time with this. They are so used to following a particular procedure to solve a problem with all the same type of problem grouped together. They really have very little experience with modeling.

PROBLEM – A Norman window is going to be built with the perimeter of 30 ft. A Norman window has the shape of a rectangle with a semi-circle attached at the top.  The diameter of the circle is equal to the width of the rectangle.  Your job is to determine the dimensions of the Norman window that allows the maximum amount of light to pass through.  

The modeling we do in this class is still pretty structured but we try to do things with a little bit of open ended discussion to start.

So we start off our modeling adventure with this problem:

I ask students - any thoughts on what to do, discuss. Coming back together there are a lot of unformed ideas but they do know how to maximize the volume via the graph in a graphing calculator (we don't do derivatives in this course, that will be next year). Maybe if I gave them a lot more time there would be some progress in solving but they had all summer to do the Norman window problem with very poor result.

So we talk about using our great mathematical toolbox of concepts and formulas. There is so much out there we can use. And in a job there won't be "steps to follow" in solving a problem. You'll have to consider all the possible tools available to you. Some brainstorming will usually happen and then you'll go forward and see what you can do.

So back to those tools available to us. I ask students to pick out some mathematical concepts in this problem and underline them.
Great - now we just have to merge all those concepts together in a way that we can analyze and answer the question.

Students are not good at writing functions or merging functions. So they need to see what that looks like. So we go back and do some easier problems. We highlight what concepts are necessary and write them out with specific information for the problem. Then we merge the concepts together in one function. Here are some examples we do.


2)     A wire of length x is bent into the shape of a square.
i)  Express the perimeter of the square as a function of x.
a) Using your calculator, draw a sketch of the function.  State the window and label the zeros and max/min point(s). 


b)  What is the parent function?
c)  Using interval notation, state Domain  & Range                        
d)  State the domain and range of the problem situation.

     
ii)  Express the area of the square as a function of x.
a) Using your calculator, draw a sketch of the function.  State the window and label the zeros and max/min point(s). 


b)  What is the parent function?
c)  Using interval notation, state Domain  & Range                     
d)  State the domain and range of the problem situation.      


3)     A right triangle has one vertex on the graph of y = x3, x > 0, at (x, y), another at the origin, and the third on the positive y-axis at (0, y). (see the figure) Express the area of the triangle as a function of x.


While doing some of these we also consider the graphs of the resulting functions. We compare the "parent" graph and the "problem situation" - how and why they may differ. This is important. Those smart math kids are so good at regurgitating back formulas without truly understanding what they mean. Being able to communicate the requirements of the problem situation shows good understanding of the problem.

Finally we go back to the starting example above and solve it. I get the students to do a lot of the work in their small groups with leading questions. I also have them draw both graphs - of the parent function (a nice cubic) and the problem situation (first quadrant, looks kind of parabola like....). And what's a good window for the problem situation? Is that the domain & range? Nope, so how do we find that? Lots of back and forth and then students get to work on another piece of the problem.

Turns out the figure that has maximum volume is actually a cube. I thought there would be some ahas going around the classroom but surprisingly to me most of them have never worked through a problem where they find what dimensions of a rectangle has a perimeter of ____ (any fixed value) and found that the rectangle closest to a square has the greatest area. I figured they saw that somewhere in their math career - middle school? high school geometry? sigh.

So this was day 1 of modeling (82 minute block) with homework that had some structured 2D modeling problems.

Next class...

We start with a quiz on a previous topic (graphing calculator skills) and then they work on the Norman Window again in small groups. Hopefully with better success after giving some framework to modeling with geometric functions n the previous class.


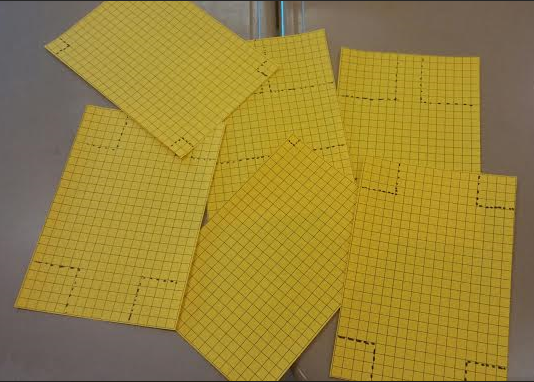
After that we do a little prep for their box problem project. Each table has a piece of colored grid paper (17 by 25) with a square of a fixed dimension drawn in each corner (squares all the same size, each table has different square sizes than other tables).

They cut out those squares and fold up to create a box that is open on the top.

  Each table compares all their different sized boxes.

 I tell them that with this project they have to find the box with the maximum volume and what size square must be cut out of each corner to create this box. There are a bunch of other details they have to communicate. All found in the description in the folder below.

Everyone gets a personalized box project description. I fill in different dimensions for each of the students. Unfortunately there can be a fair amount of academic dishonesty in our school, especially with stressed out advanced student. So this is a necessary step to keep everyone honest. A bit of a pain to grade, but worth the piece of mind.

All documents found HERE.

Tuesday, July 21, 2015

Linear Inequalities in 2 variables


What was interesting when we first started working with the common core curriculum in our state workshops four summers ago is that linear inequalities in 2 variables was NOT in the topic list but systems of linear inequalities was included!  So we realized pretty quickly that we had to add this topic if the students were going to have a successful experience with systems.

Here are my ISN pages. I realize that I need to have one of my examples be a negative slope. So I'll change one of my examples for next year. Here is the document with both pages.


Here is a homework worksheet I used for graphing and a nice enrichment worksheet for those who catch on to this topic quickly and need a challenge (given graph, write linear inequality).

I'm a fan of having students compare & contrast things in math class and Venn Diagrams are a great way to do that. These make a good warm up activity for students to fill in with their groups and then we have a giant one on the board to have students come up and fill in. Here is my worksheet.

My advanced students are very good at learning procedures and working through problems. But I want them to be able to articulate what the solutions are for each of these. (we talk about solutions quite a bit all year - haven't mentioned it in the blog so far - but a lot of what we are doing in algebra one is working with solutions.....and a solution isn't necessary a single number). This is a nice critical thinking worksheet getting them to think about the solution sets for equations and inequalities. 

We also did applications of linear inequalities in two variables - but I didn't get to make an ISN foldable for these. At this point in our school year it was the end of semester one and we were wrapping up so we could have a unit test and start to prepare for our midterm exam. But here are some materials I used with my students.


Saturday, July 18, 2015

Linear Equations - All Forms & Applications

We cover all three forms of linear equations in my Algebra One class. Students learned about and used slope intercept form last year (8th grade common core) so they have had some experience working with y = mx + b. My goals for them now is to graph a linear equation in any form, write a linear equation in any form given information about the line, convert between the three forms and use all three forms in application situations. This takes a number of blocks but I will post all the ISN materials in one post.
We go through each form - discuss, work in groups to explore & practice. We summarize in our ISN. All the bright yellow "left hand learning" are found here (in large 11 by 17 document - I got a great deal on this paper, but you can change size to 8.5x11).

Two page spread for Slope Intercept Form:


Right hand reflect for each are examples that students work through. 


Another two page spread for Point Slope Form:


And another two page spread for Standard Form.


At this point students were asking, "how do we know which form we are working with?". So we brainstormed characteristics and made a page in our ISN for helpful hints on identifying.


Graphing Practice:

And here are some "graphing packets" for each form that I had students work on for practice:

 Working between the three forms (convert, write, etc!) 

 ISN "Writing all 3 forms given a graph"  and  the three examples


....with some documents I had students use to work between the forms:
Class Practice
More Class Practice
Quiz

 Applications

I use the ISN to go over examples for each and how you identify which form is used. This only takes up three pages. I need to make a fourth page that is a "you choose" application. Not sure what I'll do with that yet, feel free to send me suggestions via comments below.


After introducing we do a bunch of practice - in their small groups and for homework. Here are some documents that I have used;

 Helping Others
Homework
More with Standard Form
 Which Form Do You Use?
Windchill Exit Slip
More Writing & Using
You Choose Water Packet