Thursday, September 10, 2015

Algebra One Sequences - Honeycomb Performance task

We start the school year with a short little unit on sequences. Not the usual longer approach you see in Algebra 2 or PreCalculus with sequences & series. Just dabbling in arithmetic and geometric sequences. A little bit with Fibonacci and Pascal's triangle. And maybe some "other" types (like triangular numbers). It's a nice way to start the year, looking at patterns and making sense of them.

I've had a few posts on this unit already. Some specifics on my ISN foldables and some expanded thoughts on developing the rules for arithmetic and geometric sequences.

This post is to share a little more information on how we end the unit. We do the usual test with study guide prep. But every unit in Algebra 1 in our school has a performance task. This one is called the Honeycomb Performance Task.

The Basic Task:

You are an engineer for Plasticore Corporation who makes custom tables of varying sizes for banquet halls. You have been asked to design and manufacture round banquet tables with layered honeycomb cores. Each honeycomb in the core has a height of one foot.  The size of the honeycombs do not change, as the size of the table increases the number of honeycomb layers increases.  


a)  Your team at Plasticore has been asked to build a table that measures 15 feet in diameter. Each individual honeycomb cell costs $0.25 to manufacture, including material and labor costs. What is the total cost to manufacture the honeycomb core for your table?

b)  Plasticore just got an order from the Aquaturf for 80 tables that measure 15’ in diameter. What is the total cost for the honeycomb cores used to build the 80 tables?

c)  Since The Plasticore Corporation is located in the state of Connecticut, Aquaturf has to pay 6.35% sales tax on the total cost calculated in part (b). Also Plasticore charges a shipping and handling delivery fee of 10% of the pre-tax cost.  Calculate those two extra fees and find the final total cost of the Aquaturf order of eighty 15 feet diameter honeycomb core tables.

Preparation before the task:


Before students are given the performance task we do a little preparation (yes of  course there are all the lessons of this unit but also...) with a honeycomb exploration. 

Honeycombs are a network of hexagons that bees create for their hives. They are a wonderful natural shape because they efficiently use material for the amount of area they create and they are strong. This task has you creating a network of honeycombs.

Work with your group to create the following honeycomb stages on hexagonal grid paper. You should have 5 different color pencils, markers or highlighters.  Let’s see how a honeycomb shape can be built starting with a single hexagon and building out.

PART ONE:

1A)  The center of your honeycomb is the black hexagon in the center of your grid paper.  For stage one, choose a colored pencil and color all the hexagons that touch the black hexagon.  How many hexagons did you color for stage 1?  Enter this number into the table below in the “Number of Hexagons Added” column. 


1B)  For stage two, choose a different pencil and color all the hexagons that touch a stage 1 hexagon.  You should now have two “rings” of hexagons colored.  How many hexagons did you color for stage 2?  Again, enter this number into your table in the “Number of Hexagons Added” column. 

1C)  Now choose a different color and color all the hexagons around this first layer you did. Enter this number into the table for stage 3. Continue this coloring method & recording for stages 4 & 5. 


Students then create a visual pattern with colors that they investigate using what they know about sequences. Everything is detailed in the document honeycomb patterns.


Once they've got all that (they do this in small groups and compare results, tweaking as they go). They are ready for the performance task.

We talk through the scenario. And I show them a model of a honeycomb core "table" that I made (with corrugated cardboard, an xacto knife and glue gun).


This model has an accompanying circular "cover" so they can see how the table has the core in it to stabilize and strengthen the table.

Then they are on their own to complete all the parts of this task. We do focus on the mathematical standards of "Make sense of problems and persevere in solving them", "model with mathematics" and "look for and make use of structure". Especially the perseverance piece. So there is no more classtime for this task, they are on their own and the rubric has a 4 point score for perseverance. (we've had a problem with students "not trying" so this motivates them to really use all the tools available to them and persevere!). 

All documents are found here

Wednesday, September 9, 2015

PreCalculus Modeling

After establishing the parent functions in PreCalculus we take a little side trip to explore modeling.


Students had the Norman Window problem to do this summer as part of their summer prerequisites packet. Everyone (predictably) had a difficult time with this. They are so used to following a particular procedure to solve a problem with all the same type of problem grouped together. They really have very little experience with modeling.

PROBLEM – A Norman window is going to be built with the perimeter of 30 ft. A Norman window has the shape of a rectangle with a semi-circle attached at the top.  The diameter of the circle is equal to the width of the rectangle.  Your job is to determine the dimensions of the Norman window that allows the maximum amount of light to pass through.  

The modeling we do in this class is still pretty structured but we try to do things with a little bit of open ended discussion to start.

So we start off our modeling adventure with this problem:

I ask students - any thoughts on what to do, discuss. Coming back together there are a lot of unformed ideas but they do know how to maximize the volume via the graph in a graphing calculator (we don't do derivatives in this course, that will be next year). Maybe if I gave them a lot more time there would be some progress in solving but they had all summer to do the Norman window problem with very poor result.

So we talk about using our great mathematical toolbox of concepts and formulas. There is so much out there we can use. And in a job there won't be "steps to follow" in solving a problem. You'll have to consider all the possible tools available to you. Some brainstorming will usually happen and then you'll go forward and see what you can do.

So back to those tools available to us. I ask students to pick out some mathematical concepts in this problem and underline them.
Great - now we just have to merge all those concepts together in a way that we can analyze and answer the question.

Students are not good at writing functions or merging functions. So they need to see what that looks like. So we go back and do some easier problems. We highlight what concepts are necessary and write them out with specific information for the problem. Then we merge the concepts together in one function. Here are some examples we do.


2)     A wire of length x is bent into the shape of a square.
i)  Express the perimeter of the square as a function of x.
a) Using your calculator, draw a sketch of the function.  State the window and label the zeros and max/min point(s). 


b)  What is the parent function?
c)  Using interval notation, state Domain  & Range                        
d)  State the domain and range of the problem situation.

     
ii)  Express the area of the square as a function of x.
a) Using your calculator, draw a sketch of the function.  State the window and label the zeros and max/min point(s). 


b)  What is the parent function?
c)  Using interval notation, state Domain  & Range                     
d)  State the domain and range of the problem situation.      


3)     A right triangle has one vertex on the graph of y = x3, x > 0, at (x, y), another at the origin, and the third on the positive y-axis at (0, y). (see the figure) Express the area of the triangle as a function of x.


While doing some of these we also consider the graphs of the resulting functions. We compare the "parent" graph and the "problem situation" - how and why they may differ. This is important. Those smart math kids are so good at regurgitating back formulas without truly understanding what they mean. Being able to communicate the requirements of the problem situation shows good understanding of the problem.

Finally we go back to the starting example above and solve it. I get the students to do a lot of the work in their small groups with leading questions. I also have them draw both graphs - of the parent function (a nice cubic) and the problem situation (first quadrant, looks kind of parabola like....). And what's a good window for the problem situation? Is that the domain & range? Nope, so how do we find that? Lots of back and forth and then students get to work on another piece of the problem.

Turns out the figure that has maximum volume is actually a cube. I thought there would be some ahas going around the classroom but surprisingly to me most of them have never worked through a problem where they find what dimensions of a rectangle has a perimeter of ____ (any fixed value) and found that the rectangle closest to a square has the greatest area. I figured they saw that somewhere in their math career - middle school? high school geometry? sigh.

So this was day 1 of modeling (82 minute block) with homework that had some structured 2D modeling problems.

Next class...

We start with a quiz on a previous topic (graphing calculator skills) and then they work on the Norman Window again in small groups. Hopefully with better success after giving some framework to modeling with geometric functions n the previous class.


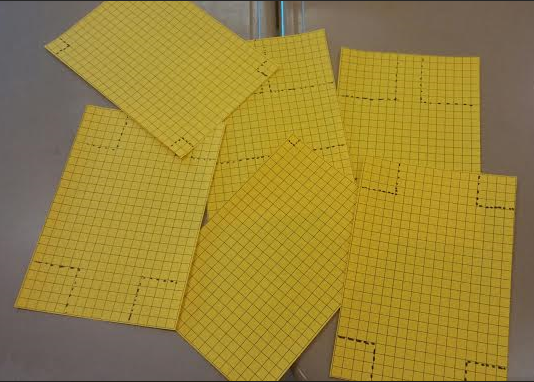
After that we do a little prep for their box problem project. Each table has a piece of colored grid paper (17 by 25) with a square of a fixed dimension drawn in each corner (squares all the same size, each table has different square sizes than other tables).

They cut out those squares and fold up to create a box that is open on the top.

  Each table compares all their different sized boxes.

 I tell them that with this project they have to find the box with the maximum volume and what size square must be cut out of each corner to create this box. There are a bunch of other details they have to communicate. All found in the description in the folder below.

Everyone gets a personalized box project description. I fill in different dimensions for each of the students. Unfortunately there can be a fair amount of academic dishonesty in our school, especially with stressed out advanced student. So this is a necessary step to keep everyone honest. A bit of a pain to grade, but worth the piece of mind.

All documents found HERE.

Sunday, September 6, 2015

Algebra One More on Geometric Sequences


I posted earlier this year with my ISN materials on geometric sequences in Algebra One. This post is to flesh things out a little bit. This all takes place over three blocks.

We finished up arithmetic sequences and I introduced geometric sequences by posting two sequences on the board (one with r = 2 and the other with r = 1/2) and asked how these were different from the arithmetic ones we just did. Discussion ensued with question about what the graphs might look like? So we graphed them and noticed they didn't look "linear". (are these supposed to be straight?). Why aren't they "straight"? - because of how quickly they grow. Anyone know a word that describes growth that might start slow but then speeds up very quickly? (exponential). We explored a few different sequences and looked at some "application type" problems (bubbles, bouncing ball).

It was easy enough to create recursive rules for these. It was the explicit rule that was a little harder. So we broke down what actually is happening term to term. Here's what that looks like:


How does the number of factors relate to the term number? (one less, thus (n-1)). So from there we developed the explicit formula.

Then we had a summary with our ISN foldable.


There was some confusion - some scenarios described "starting" with something and then data for after the first, second, third (etc) minute (or some other unit). So the start is really the "0 term" when creating formulas. We explored how the explicit formula with the zero term means the same thing as the formula with the first term. This takes a few examples to recognize. Have students explore this and see how they are the same.


This distinction between the two is pretty important and helps to later relate these easily to exponential functions. 

Now we go into class block #2 on this topic. I started with the "birthday problem" as a warm up (see documents below). They compare two scenarios to decide which is better. Discussion takes place when they recognize they are examples of arithmetic and geometric sequences and that geometric is a far better option. 

Next we looked at scenarios that involved percentages. Here are two examples we discussed:
o   Ex 1 – special hair potion, hair will grow 5% a week. Start with 8 inches.
o   Ex 2 – your jeans will shrink 5% in length very time they go through the dryer. Starting length = 32 inches.

They had to learn how to translate percent growth & decay into sequences, finding an "r" value. So this took a little time and exploration. They can do percentage change but do it as a two-step process. The trick was to get them to recognize that "growth" results in something greater than 100% thus in example 1 r = 1.05 (105%) while decay results in something less than 100% thus example 2 r = 0.95 (95%). I don't like to just tell them how this work, I like them to play around with the numbers to try to figure it out first and discuss amongst themselves. I usually end up doing a little of both because of time constraints.

Then students had a bunch of practice problems to do. A good idea here is to have students make up a growth and a decay scenario and create a sequence to go with it. Students get super creative with this.

Then we went into class block #3 on this. Warm up was some practice problems to go in the ISN opposite the foldable pages.


Finally we examined geometric sequences in the context of fractals. Most of my students never heard of a fractal. So we first did a little intro worksheet together of drawing a simple fractal design. From there we went to Sierpinski's triangle. There is always some moaning & groaning here, do we have to draw stage 4? I leave that up to them, if they just want to recognize the pattern and state how many USRs there are, that's fine. (but there are always a good handful who do want to draw it!).


 And we finish up class by watching a few youtube videos. Students explore Koch's snowflake for homework.

fun with fractals:

fractals in nature


Koch's snowflake zoom:


All the documents can be accessed HERE

Saturday, September 5, 2015

Algebra One Explicit Rules for Arithmetic Sequences

About 4 years ago we started to adopt the common core curriculum. At the high school level we started with Algebra One. It was a pretty crazy year but we got through it. One of the crazy learning expectations was that students would be able to create an explicit rule for both Arithmetic and Geometric sequences. It made me laugh out loud to see how we were supposed to do this with 8th & 9th graders. All the materials I read made it sound like students would intuitively develop the formulas just from examining sequences and recognizing regular behavior. hahahhahha. right. The first year I even tried to develop the formulas the usual way (that I've done for years in PreCalculus)

Nope, didn't stick. My students just did their best memorizing the formula.
Well finally I thought about - what do students already know? Yes in 8th grade they did learn about rate of change, slope and the slope intercept equation. And arithmetic sequences are linear. So I decided to use what they already know to develop explicit rules for arithmetic sequences


We started by graphing the sequence (took some time for students to figure out how to do this since they were only single number values and not ordered pairs).

Then we discussed how it appears to be linear. I did ask them should we connect the points to actually make a line (why isn't this continuous?). Then we talked about how we could write an equation for this line. They remembered rate of change really well and could tell me what it was from the graph. They were a bit puzzled at first on how to find the y-intercept. But they then used the slope to get to the y-axis. We did a bunch of these graphically. They were really liking it and were very good at finding the explicit rule.

But then I told them they should be able to do this without graphing - how can we do that? Students discussed this amongst themselves and came up with a method of doing this. Basically the sequence is "built" by adding the common difference. So if we do the opposite of the common difference we can get to the 0th term. Pretty cool. About half the class really got this. So those kids did really well on the homework. With some more examples for students to work through the next day I think they've all got it now.

Much better than that standard arithmetic explicit rule formula.

Friday, September 4, 2015

PreCalculus Function Basics and the Graphing Calculator

The technology in our mathmatics classrooms are pretty much limited to graphing calculators. We can support our teaching with our LCD player and can occasionally use document cameras and computers (there is a computer lab with 24 computers used by computer science classes but open other blocks for other classes).

There is a lot you can do with graphing calculators. They are a big part of my precalculus curriculum.


Over the years students do regression work and systems of equations and other cool things. There is  a cool project I do with precalculus that involves piecewise functions and creating a picture on their calculator (although they can use a computer equivalent to do this).

A big use of graphing calculators in PreCalculus is to analyze functions.  In Algebra 2 students learned a half dozen or so parent functions and learned about extrema, zeros, & increasing/decreasing intervals. So I start our analysis by refreshing those skills and the use of graphing calculators.

After a warm up quadratic to analyze graphically, we go through a foldable that has little reminders and important things to remember in starting off this basic analysis.

Then students work through an example to apply all these skills.


My expectation is that they already know all this, we're just fine tuning and clearing up any misconceptions. 

And there are always a few students who feel very intimidated by their graphing calculators. So this helps them. I also refer them to my "graphing calculator handbook" that walks them through the whole process of each of this skills (with screen shots to help them visualize what to do). I post this on my school webpage for students to access.

All documents can be found HERE


Thursday, September 3, 2015

PreCalculus Parent Functions


Our first unit in PreCalculus is essentially function analysis. Students learned about a few parent functions in algebra 2 last year and did some analysis. We are going to round things out and look at all the parent functions and sort of formalize our analysis with more complicated examples.

So we start off by exploring the parent functions. I've organized this in different ways over the years. And I'm pretty happy with my categories now. We do a big project later this semester where students create a picture on their graphing calculators using piecewise bits of as many parent functions as they can. The more variety of function types, the more points they can earn. So I wanted nice clear categories for my parent functions.

This is what I have:


1)  The Identity (or Linear) Function f(x) = x    

2)  Quadratic Function (even power polynomial parent)  f(x) = x2                                             

3)  Cubic Function  f(x) = x3  (odd power polynomial parent) use window  [-6, 6] [-4, 4]   

4)  Absolute Value Function  f(x) = |x|     also can be seen as the original piecewise function 

5)  Rational or Reciprocal Function (negative exponent power function)  f(x) = 1/x

6)  Square Root function  f(x) =  sq rt x (fractional exponent power function)                            
7)  The Greatest Integer Function  f(x) = int(x) also written as f(x) = [x].  also called a step function. 

8)  Exponential FUNCTION   f(x) = a(b)x     we break this down by looking at two graphs for this function; GROWTH when b > 1 (do f(x) = 2x and DECAY when 0 < b < 1 (do f(x) = (1/2)x). 

9)  Logistic Function   

10)  Logarithmic Function  f(x) = ln x   

11)  Sinusoidal Function – examining graphs for both Sine Function  f(x) = sin (x)      and   Cosine Function  f(x) = cos (x) 

12)  Tangent Function  f(x) = Tan(x) 

Students start summarizing these by doing a little exploration on their graphing calculator. In their ISN they will draw the graph for each function and identify the domain & range. They use this worksheet to guide their work.

Here is what my pages look like so far in the ISN. (I messed up and cubic function is in the wrong order, sigh, but they are all there). And later we will fill in some other interesting characteristics of those functions.


Wednesday, September 2, 2015

PreCalculus Domain and Range

We start right in on the first day of school with reviewing Interval Notation, Domain & Range. We start with interval notation and I use a worksheet of examples for discussion. Students go up to the whiteboard and write out the interval notation. We also talk about what domain & range are. They have spent a lot of time in Algebra 2 on this topic so should be very good with it. So this should just be a review. I like coolmath.com's style and find this a good resource in understanding the finding of domain without a graph.  Range at this point we find graphically, using the domain to guide us in our investigation of range.

We summarize these three topics with a foldable.


And the next class block they have a warm up where they find both the domain & range of two examples.

Here are the documents I used (foldables, worksheets, etc)