I've taught this a few different ways. Here is an old powerpoint I have used to go over the concept.
ISN pages
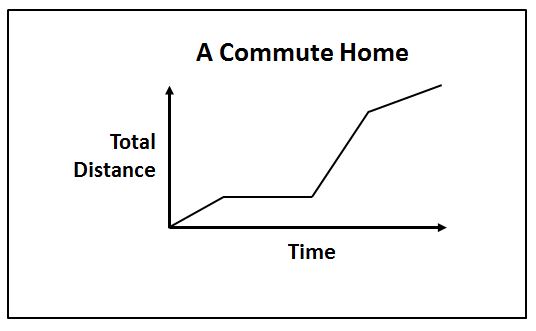
My "left hand learn" page is a closer look at the dependent variable of "distance" vs "speed". They can look very different.

I also want to squeeze in a graph that doesn't make sense. Have to play with spacing and size here for next year.


And my "right hand reflect" page is sorting cards. These can be challenging and I limited the choices to 5 different ones from my original document. (taking the "what's wrong with this graph" off this page and having it on the left learning page).

Then I have various worksheets that can be used for practice (HW 1, HW 2), classwork and exit slips.
Once they get the idea of this and have had some practice graphing and describing this is a really fun activity! Found at graphingstories.com. It's a perfect shortened block activity (to use on one of those professional development half days we have or the half day before thanksgiving if the timing is right). It's really really fun and the students get really into these graphs. Definitely preview the videos first and choose which ones you want to use. We don't get to all of them, so I try to have a nice variety. And they vary in level of difficulty so I try to do some easier ones first to get them used to it.

No comments:
Post a Comment